31.9.7 Histogram/Distribution Graph
| |
|
|
|

|
|
Data Requirements
- Worksheet: select one or more columns (or a range from one or more columns).
or
- Matrix: Select a matrix sheet. If multiple matrix objects in the sheet, the active matrix object is plotted.
or
- Image: Select an image window. If multiple frames in the image, all frames will be plotted. Refer to Notes below to see how to view through all frames.
Creating the Graph
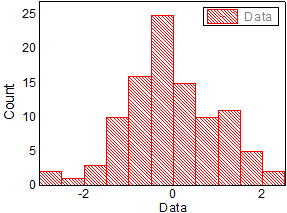
Histogram
- Select required data.
- From the menu, select .
- or
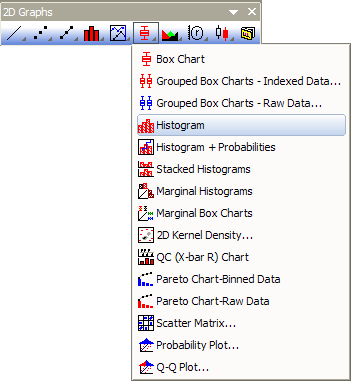
- Click the Histogram button on the 2D Graphs toolbar.
Histogram with Distribution Curve Overlapped
- Select required data (worksheet).
- From the menu, select .
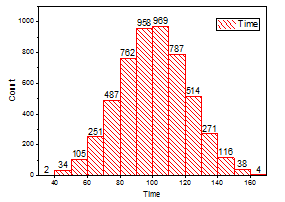
Histogram with Labels
- Select required data (worksheet).
- From the menu, select .
Please see more details on creating and customizing the Histogram Graph.
Template
Hostogram: HIST.OTP
Distribution: HISTDIST.OTP
With Label: HistLabel.OTP
All three templates mentioned above are installed to the Origin program folder.
Notes
- The menu command plots each selected data set in the same layer.
- Histogram with Distribution Curve Overlapped can be created from a histogram graph by selecting a distribution type from Distribution Curve: Type drop-down list on Data tab of Plot Details dialog. Similarly, the histogram graph with labels can be created from a histogram graph by enable labels on the Label tab.
- For multi-frame image, all frames will be plotted. To view all frames,
- Click Column Switching Browser Graph button
 from page level mini toolbar. This will open the navigation panel on the left.
 - Click trianlge button

- Flip Through: view through frames by step(s) you specified.
- Auto Rescale - None/Y Only/All: do not auto rescale axes/auto rescale Y axis/auto rescale both XY axes.
- Rescale - Y Only: manually rescale Y axis.
- Click Column Switching Browser Graph button
