31.18.15 Hexbin Plot
Contents
Data Requirements
Select XY/XYZ columns/virtual matrix (a block of worksheet cells)/matrix to plot hexbin plot.
Creating the Graph
Select required data.
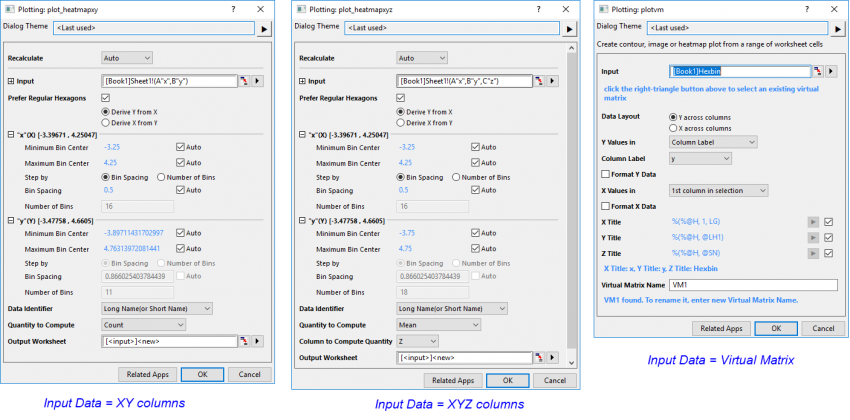
From the menu, choose open the plot_heatmapxy or plot_heatmapxyz or plotvm dialog.
Please note, when the input data is matrix sheet, no dialog will be opened and the Hexbin plot will be created directly.
Special Controls for Hexbin
Prefer Regular Hexagons
This option is checked by default and only works for the square layer frames(1:1 aspect ratio); if the aspect ratio of the layer frame changes, you will need to calculate the values yourself using the formula provided below:
- x number of bins = ( sqrt(3) * y number of bins ) * (layer width/ layer height)
- y number of bins = ( x number of bins / sqrt(3) ) * (layer height/ layer width)
There are two radio boxes: Derive Y from X and Derive X from Y
- Enable the radio-button group when Prefer Regular Hexagons is selected; otherwise, disable it. Select Derive Y from X by default.
- When Derive Y from X has been selected: Keep the X binning and derive the Y binning: new_ny = int(round(nx / sqrt(3))); Disable the Y binning options, including Min Center, Max Center, Bin Spacing, and Number of Bins.
- When Derive X from Y has been selected: Keep the Y binning and derive the X binning: new_nx = int(round(ny * sqrt(3))); Disable the X binning options, including Min Center, Max Center, Bin Spacing, and Number of Bins.
Template
Hexbin.OTPU (installed to the Origin program folder).
Notes
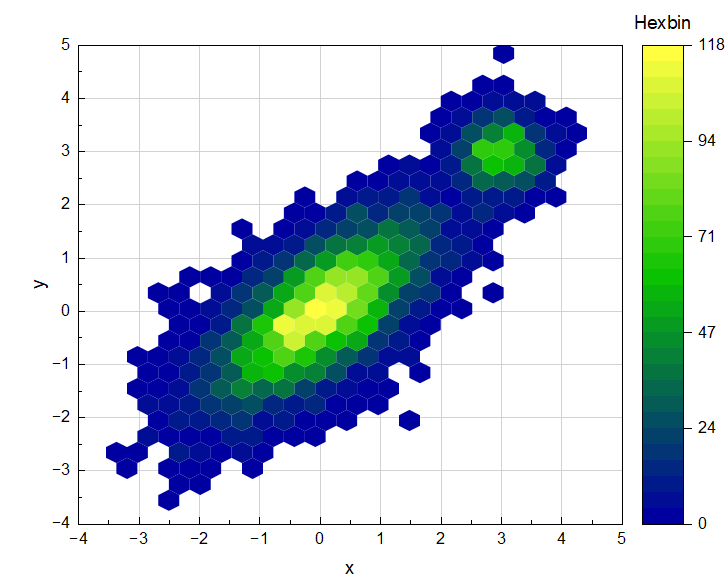
A hexbin plot, a variation of heatmap, is a type of two-dimensional histogram where the bins are hexagonal and the color represents the number of data points within each bin.