31.18.9 Heatmap with Split Tiles
Contents
Data Requirements
Worksheet: Select XYZZZ... /XYZXYZ... columns (full or subrange); XYY... columns as virtual matrix.
Matrix Sheet: A matrix sheet with multiple objects.
Creating the Graph
- Activate a worksheet with virtual matrix data, or XYZXYZ.../XYZZ... columns, or a matrix sheet with multiple objects.
- From the menu choose .
Source Data : Virtual Matrices
If plotting from a worksheet with virtual matrices(no Z columns there), the plotmultivm dialog box that opens:
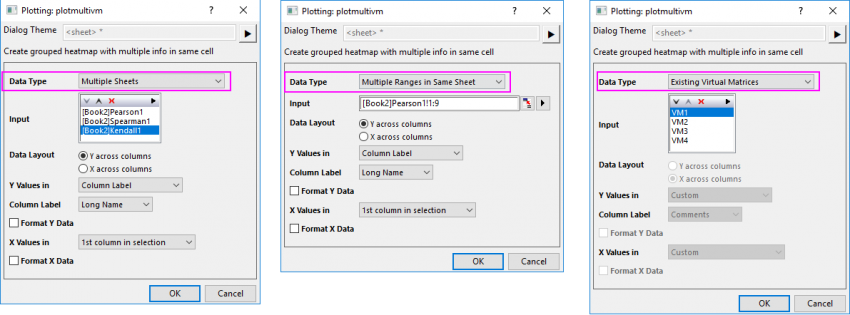
Three options for Data Type:
- Multiple Sheets: You can select multiple sheets as Input; All sheets should have same dimension; X values and Y values should be stored in same postion of sheets and with same values.
- Multiple Ranges in Same Sheet:You can select multiple data blocks with same dimension in same worksheet as multiple input vritual matrices. To select these blocks, you need keep pressing Ctrl key to highlight them separately.
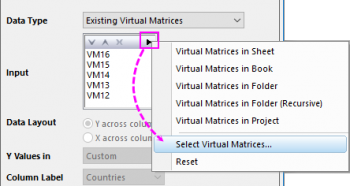
- Existing Virtual Matrices: You can select multiple virtual matrices; choose Select Virtual Matrices... under the fly-out menu of Input box will open Virtual Matrix Manager.
Once you selected the Input Data, the other settings in this dialog are similar with the controls in plotvm dialog.
Source Data : XYZZ... or XYZXYZ...
If plotting from multiple XYZ columns or XYZZ... columns, the plot_heatmapxyz dialog box that opens:
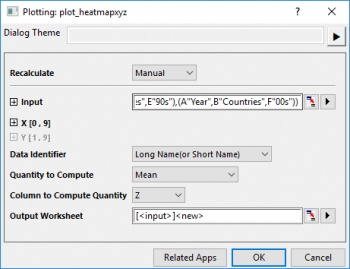
Note: This dialog makes no difference for Heatmap and Heatmap with Split Tiles created from XYZ dataset. Multiple Z columns will be plotted into same heatmap cell as pieces.
Source Data: Matrix sheet with multiple objects
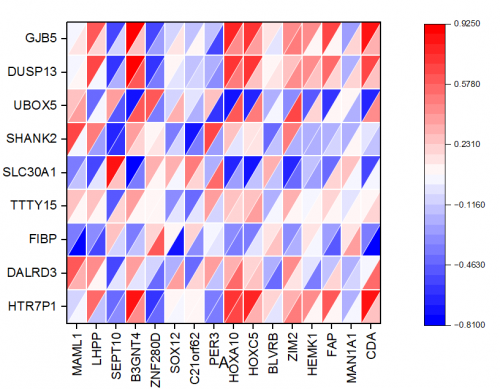
If you stored the source data in multiple matrix objects in a matrix sheet, selecting will plot a Heatmap with Split Tiles directly with values at same location from different objects dividing the same heatmap cell.
Template
Heat_Map_Multi_var.OTPU
Notes
This plot is an advanced variant of Heatmap, which supports to plot grouped heatmap in same cell.
- A specific Group tab in Plot Details dialog allows you to specify how to split the heatmap cell according to the number of Z values.
- Display tab and Label tab can be used to customize the heatmap with split tiles, just like that for Heatmap.
- Mini toolbar buttons are also added to customize the display of heatmap with split tiles.
Version Information
| Minimum Version: Origin 2024 |