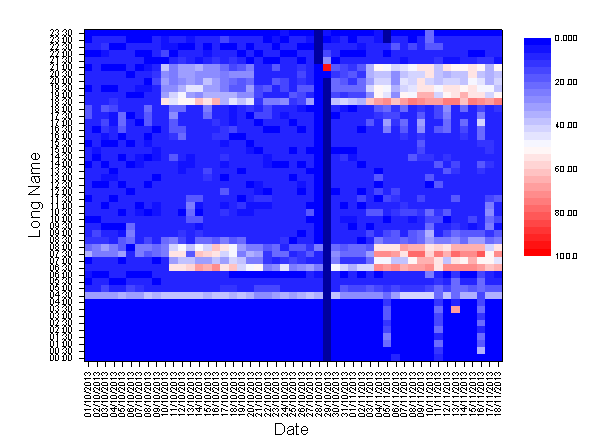
29.18.5 Heatmap
Heat_map
Data Requirements
- Worksheet: Select XY columns or XYZ columns (full or subrange); or a virtual matrix.
or
- Matrix: A matrix sheet. Multi-object sheet is supported.
or
- Image: An Image window. Multi-frame image is supported. Refer to this page below to see how to flip through all frames.
Creating the Graph
Activate the matrixsheet or select required data from worksheet or an image window.
From the menu, choose .
or
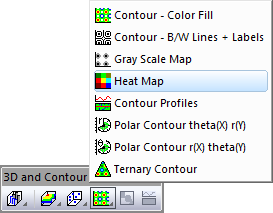
Click the Heatmap button on the 3D and Contour Graphs toolbar.
Template
HeatMap.otp
(Installed to the Origin program folder).
Notes
This graph is based on the contour plot but has some differences:
- Ticks are centered on the block. No minor ticks are shown.
- When plotting from XY worksheet data, a 2D frequency count is performed on XY data, based on user-specified input. By default, bins are automatically chosen and a count of XY pairs is assigned to each bin. The resulting binned output is used to generate the heatmap, with bin centers in output sheet label rows supplying Y axis ticks/labels and bin centers in the first column supplying X axis ticks/labels. Binning is handled by the plot_heatmapxy X-Function.
- When plotting from XYZ worksheet data, a 2D frequency count is performed on XYZ data, based on user-specified input. By default, bins are automatically chosen and a mean Z value is calculated for each bin (note that the user can specify other statistics). The resulting binned output is used to generate the heatmap, with bin centers in output sheet label rows supplying Y axis ticks/labels and bin centers in the first column supplying X axis ticks/labels. Binning is handled by the plot_heatmapxyz X-Function.
- When plotting from a virtual matrix, the number of major ticks on the x axis will equal the number of rows; the number of major ticks on the y axis will equal the number of columns.
- By default, the heatmap plots using the Thermometer palette for the Colormap Fill. Missing values use a deeper blue color than the color for 0.
 | See this note on tick tables and date-time data.
|