31.10.10 Grouped Stacked Dot Plots
Data Requirements
Select at least one column as input, prepare at least one group column to create grouped stacked dot plots.
Creating the Graph
To create a Grouped Dot Plot:
- Highlight at least one column(or a range from at least one column).
- Select to open the plot_gdot dialog. Select one grouping column at least in the Group box.
Template
StackedDot.optu (installed to the Origin program folder)
Notes
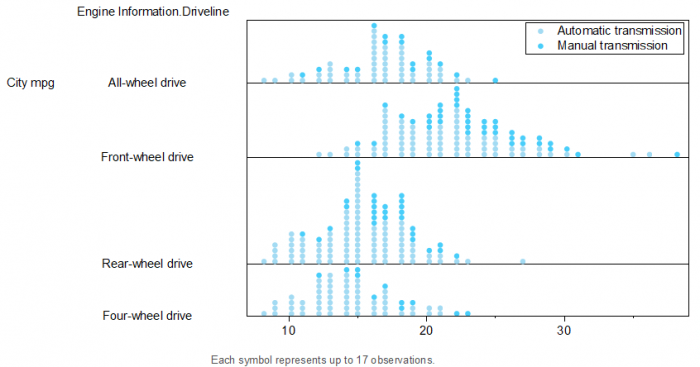
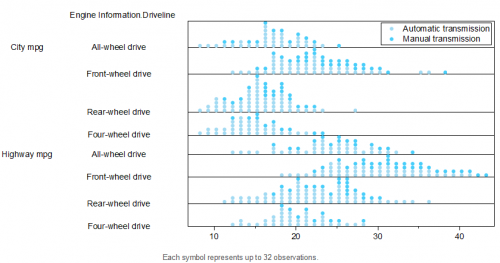
When you select multiple input columns, each column will be plotted as a grouped stacked dot plot arranging points from the base line and these grouped stacked plots will be stacked on Y axis.
If only one grouping column, you can use the Stack control to decide whether use it to plot a group dot or a stack dot. More detials, please refer to the Creating Dot Plot page.