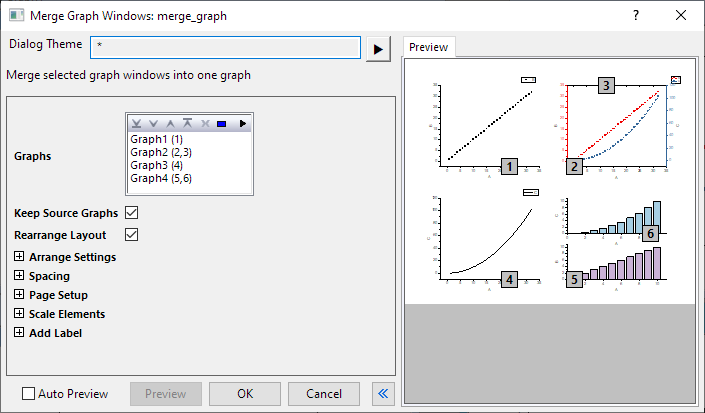
You can open the Merge Graph Windows Dialog Box from the menu Graph: Merge Graph Windows, when a graph is active.
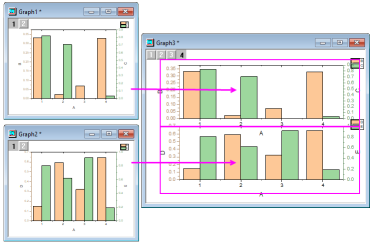
This function merges the specified graphs into a new graph window. In the new graph, the source graphs are arranged in row by col grid. If there
Lists graphs in the order in which they are to be merged. Buttons at the top of the box allow for selecting and sorting of graphs. Note the flyout menu for graph selection.
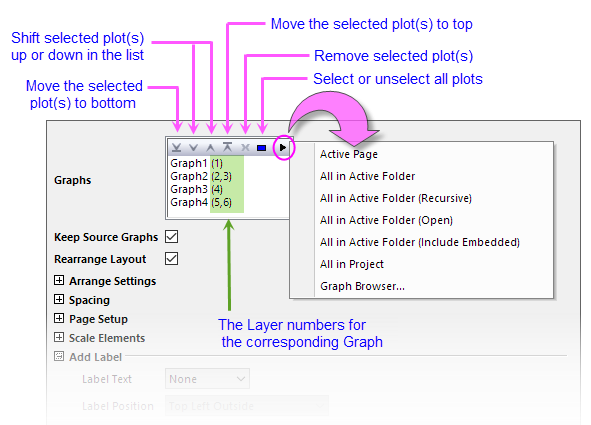
| Active Page | All graphs in the active page. |
|---|---|
| All in Active Folder | All graphs in the active folder, excluding those in the subfolders. |
| All in Active Folder (Recursive) | All graphs in the active folder, including those in the subfolders. |
| All in Active Folder (Open) | All open graphs in the active folder.
By default, this option is selected, and all opened one-layer-frame windows will be listed, including 1x1 layout multi-layer graphs. If no one-layer-frame window is opened, the opended multiple-layer graphs will be listed. |
| All in Active Folder (Include Embedded) | All graphs in the active folder, including the embedded graphs. |
| All in Project | All graphs in the current project. |
| Graph Browser... | Opens the Graph Browser (see next section). |
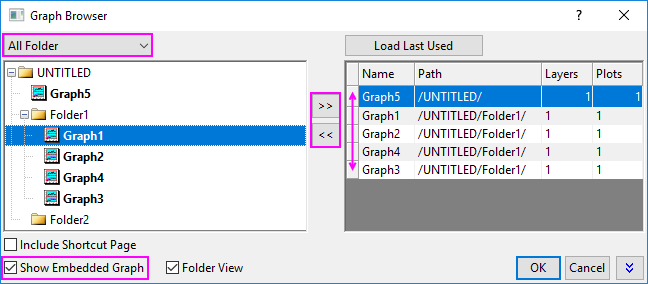
The Graph Browser is used for adding graphs to the Graphs list. Using the folder filter drop-down in the upper-left corner, you can browse all graphs in the folder and then, using the ![]() and
and ![]() buttons, add or remove graphs from the Graphs list.
buttons, add or remove graphs from the Graphs list.
A couple of things to note:
Specifies whether or not to keep the source graphs after the merging is performed.
Specifies whether to rearrange the layers that belong to graphs that include multiple layers.
Note that when merging multi-layer graphs that have linked layers, each graph will be treated as a unit thus preserving layer linking relationships within individual graphs.
Settings to arrange layers:
| Number of Rows | Specifies the number of rows in the new graph. The graphs will be arranged on a row by col grid in the new window. | |
|---|---|---|
| Number of Columns | Specifies the number of columns in the new graph. The graphs will be arranged on a row by col grid in the new window. | |
| Direction |
This tool specifies the direction for arranging graph layers in specified grid.
| |
| Use Alternate Side to Show Ticks and Labels |
Specifies whether to show Axis Ticks and Labels on left and right side (bottom and top) alternately in the graph layers.
| |
| Add Extra Layer(s) for Grid | Specifies whether to add new layers for empty grids, when the number source graphs is less than the product of the values of the row variable and the col variable. | |
| Keep Layer Aspect Ratio | Specifies whether to keep the original aspect ratio of the graph layers. | |
| Treat Each Source Graph As a Unit | When this box is checked, all layers from the same source graph are treated as a unit when merging graphs. Unlinked layers in the source graph will be linked to the original Layer1.
This control is available when Rearrange Layout has been checked. | |
| Link Source Graphs | Link all unlinked layers to Layer1 in the merged graph. Linked layers remain linked to the layer they were linked to before merging.
Note: Checking both Treat Each Source Graph As a Unit and Link Source Graph causes:
| |
| Set Layer Width by Common Scale |
The width of each layer is determined using a common scale. For instance, when drawing stacked bar charts, establishing a common scale allows direct visual comparison of bar length across layers. By contrast, when this option is not enabled, two axes with the same physical dimensions may display very different scale ranges. This control is not available when Rearrange Layout has been checked and Orientation has been set to Auto. | |
| Set Layer Height by Common Scale |
The height of each layer is determined using a common scale. For instance, when drawing stacked column charts, establishing a common scale allows direct visual comparison of column height across layers. By contrast, when this option is not enabled, two axes with the same physical dimensions may display very different scale ranges. This control is not available when Rearrange Layout has been checked and Orientation has been set to Auto. | |
| Show Axes Frame | This checkbox specifies whether to show axes frame and hide axes/ticks of graphs when axes/ticks are overlapping. |
| Unit | Specifies a unit for the gaps and margins below. Supported units: % of Page, inch, cm, mm, pixel and point. |
|---|---|
| Horizontal Gap | Specifies the horizontal gap between adjacent layers. |
| Vertical Gap | Specifies the vertical gap between adjacent layers. |
| Left Margin | Specifies the left margin to the new graph page. |
| Right Margin | Specifies the right margin to the new graph page. |
| Top Margin | Specifies the top margin to the new graph page. |
| Bottom Margin | Specifies the bottom margin to the new graph page. |
A new default Orientation setting -- Auto -- is added beginning with Origin 2021b. As explained below, this will increase page dimensions. To merge graphs onto a page of the same dimensions as the original graphs, set Orientation to Landscape or Portrait. |
| Orientation | Specifies the orientation for the new graph page, including:
By default, Auto is selected. That means, the layer size from the merged graphs will be kept. The page height and width is controlled by the sum of layer size and gaps. |
|---|---|
| Width | Specifies the width of the new graph page. It will unavailable and just show the width of the page when you select Auto for Orientation. |
| Height | Specifies the height of the new graph page. It will unavailable and just show the height of the page when you select Auto for Orientation. |
| Unit | Specifies the unit for the new graph page. |
| Note: If you specify a 1 x 1 arrangement (1 row, 1 column) of 2 or more graphs, and Orientation = Auto (i.e multiple layers overlap), Origin will use the maximum width and height dimensions of the overlapped layers/graphs. |
| Scale Mode | Specifies how the axes, axes labels, legend, data plots, and other objects that are attached to the Layer Frame or Layer and Scales are affected when a layer in the new graph page is resized.
|
|---|---|
| Fixed Factor | This variable is available only when the Scale drop-down is set to Fixed Factor. It specifies the fixed scale factor. |
| Note: If you have set a fixed factor in the Scale Elements group in Size tab of Plot Details for the graph layer, then when you merge the graph with others, and set Orientation = Auto under Page Setup branch, the Fixed Factor will be overwritten by 1. |
| Label Text | Controls for adding and formatting labels to merged graphs.
|
|---|---|
| Custom | This text box displays when Custom is selected in the Label Text drop-down list. Specify the custom label texts.
The Enable Substitution check box is selected by default, substitution notation and enumeration code are supported. For enumeration code, %(u$) and %(v$) enumerate uppercase and lowercase letters. $(i) and # enumerate index. %(p$) represents character #. |
| Label Position | Controls label position. Labels can be displayed at Top Left Outside, Top Left Inside, Top Right Outside, Top Right Inside, Top Center Inside, Top Center Outside, or Bottom Center Outside. |