8.3.9 Batch Plotting
Origin provides several ways to reuse the graph customizations with new data:
- Save customized graphs as graph templates;
- Save custom settings as graph Themes;
- Copy formats from a graph and paste them to other graphs;
- Batch plotting using specified graph with new datasets;
- Use Change X/Y/Worksheet from the context menu.
Graph Templates and Themes require saving the customizations to an external file, while Copy/paste Formats and Batch Plotting do not. Each method suits different workflows.and Batch Plotting discussed here is especially efficient when you want to duplicate a customized graph across multiple datasets arranged in the same structure.
Contents
Supported Graph Types and Data Requirements
- Supported Graph Types:
- 2D/3D/Contour graphs
Note: For most of 2D grouped graphs created from Plot menu, the grouping info column are treated as modifier columns, not data columns.
- 2D/3D/Contour graphs
- New datasets must be opened in the same project and have a similar structure to the original.
- Duplicate with new columns, the new columns should have a Plot Designation of Y(for 2D) or Z(for 3D or contour) and from the same sheet.
- Duplicate with new sheets, each sheet should have exactly the same column structure.
- Duplicat with new books, each book should have exactly the same sheet and column structure.
Batch Plotting Dialog
To do Batch-Plotting:
- Right-click on the graph title bar and select Batch Plotting..., or click Batch Plotting button
 on the Standard toolbar.
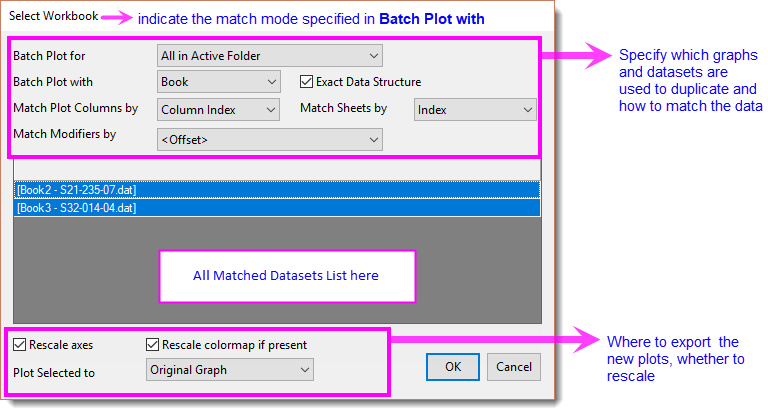
- In the dialog that opens,
- Batch Plot for: specify the graph(s) whose customization you want to reuse for new plots. See "Duplicate from Current Graph or Multi-Graphs" section for details.
- Batch Plot With: specify the new data to plot. Then specify how to match it to the original by specifying Match Plot Columns by/Match Seets by/Match Modifiers by. See "How to Match Datasets" section for details.
- Available datasets will be listed in the middle list box. Select one or more to plot.
- Plot Selected to: specify where to send the new plots. See "Output Settings for New Plots" section for details.
- Click OK to generate new graphs.

Duplicate from Current Graph or Multi-Graphs
- Select from Batch Plot for drop-down list,
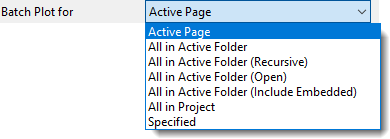
| Active Page | Use the current graph's customization to plot new graphs. |
|---|---|
| All in Active Folder/ All in Active Folder (Recursive)/ All in Active Folder (Open)/ All in Active Folder (Include Embedded) |
Loop through all the graph windows in
duplicate each graph with matched new datasets. |
| All in Project | Loop through all the graph windows in the entire project and duplicate each graph with matched new datasets. |
| Specified | Manually select specific graph windows in the project and duplicate each one with matched new datasets. |
How to Match Datasets
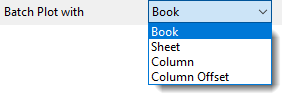
Batch Plot with Book
If all plots in the original graph are from one workbook, select Book from Batch Plot With drop-down list to duplicate the graph with other new workbooks.
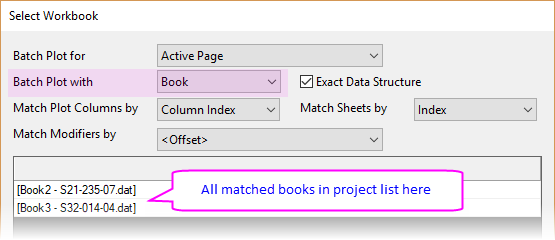
Configure the following items of matching conditions.
| Exact Data Structure | When this check box is selected (default), only books with exactly the same sheet and column structure as the source will be used to plot. If the book contains additional sheets or columns than the source, the additional will be ignored. If the book contains fewer sheets than needed to plot the graph, the book will be filtered out.
When unchecked, books with the minimum required sheets but fewer columns may show, depending upon the Match Plot Columns by option (see next). |
|---|---|
| Match Plot Columns by/ Match Sheets by |
Decide how to Match Sheet in the workbook, by worksheet Long Name, Short Name or Index , and how to Match Plot Columns, by Long Name, Short Name or Column Index to the source workbook. |
| Match Modifiers by | Specify how to match the modifiers when the original graph uses grouping info to, e.g., map to symbol color or line style. The default selection follows the Match Modifiers by control in the Miscellaneous tab of Plot Details dialog. |
Batch Plot with Sheet
If all plots in the original graph come from one worksheet, select Sheet from Batch Plot With drop-down list to duplicate the graph with other new worksheets.
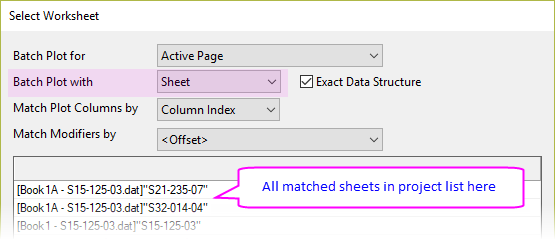
Configure the following items of matching conditions.
| Exact Data Structure | When this check box is selected (default), only sheets with exactly the same column structure as the source will be used to plot. If the worksheet contains additional columns than the source, the additional will be ignored. If the sheet contains fewer columns than needed to plot the graph, the sheet will be filtered out.
When unchecked, sheets with fewer columns than the minimum requirement may show, depending upon the Match Plot Columns by option (e.g., you may want to add more plots to the original graph). |
|---|---|
| Match Plot Columns by | Decide how to Match Sheet in the workbook, by worksheet Long Name, Short Name or Index , and how to Match Plot Columns, by Long Name, Short Name or Column Index to the source workbook. |
| Match Modifiers by | Specify how to match the modifiers when the original graph uses grouping info to, e.g., map to symbol color or line style. The default selection follows the Match Modifiers by control in the Miscellaneous tab of Plot Details dialog. |
Batch Plot with Column
If all plots in the original graph come from one worksheet, and all new columns (Y columns for 2D graph and Z for 3D graph or Contour) you want to plot with are also in the same worksheet, select Column from Batch Plot With drop-down list to duplicate the graph with other new worksheets.
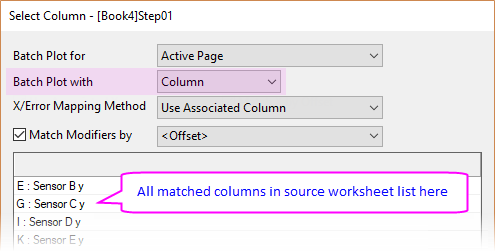
Configure the following items of matching conditions.
| X/Error Mapping Method | Select how to pick X or Error column for the duplicated plots.
|
|---|---|
| Match Modofiers by | Specify how to match the modifiers when the original graph uses grouping info to, e.g., map to symbol color, line style, or other plot attributes. The default selection follows the Match Modifiers by control in the Miscellaneous tab of Plot Details dialog.
It is strongly recommended to select <Offset> when Batch Plot with Column. It picks the modifiers by the same column-offset from the current XY column as in the original plot (i.e., how far the modifier column shifts from its XY). On the other hand, using column label (e.g., Long Name or Comment) will always map the plot attributes to the first eligible columns in the worksheet. |
Batch Plot with Column Offset
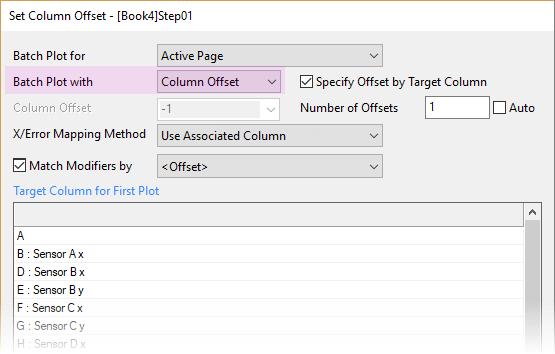
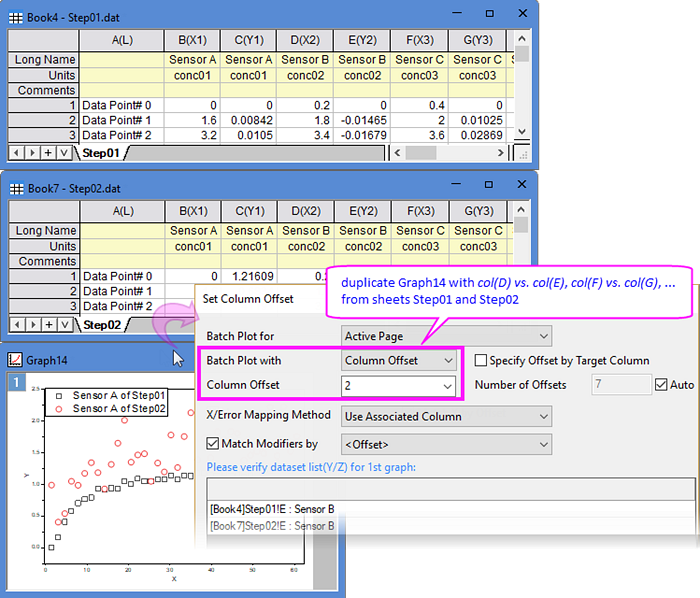
If the columns you want to plot have a fixed offset from the source columns of the original plots, select Column Offset from Batch Plot With drop-down list to duplicate the graph with new columns.
 | Column vs. Column Offset
|
Configure the following items of matching conditions.
| Specify Offset by Target Column | Check it to smartly determine the column offset. The list box will then shows available columns in the source sheet. Select the column(s) for the first duplicated graph, and Number of Offset will update accordingly.
Uncheck to manually specify Column Offset. The list box will then show the column(s) for the first duplicated graph. |
|---|---|
| Column Offset | Specify how far new columns shift from source columns. "+" counts right, "-" counts left. E.g., suppose the source worksheet contains columns A - G with plot designation XYY..., and the original graph uses Y columns D&E. Column Offset = +2 plots columns F&G; Column Offset = -2 plots columns B&C. |
| Number of Offsets | Specify the total number of sets for batch plotting. Check Auto (default) to auto-calculate with following rules:
Uncheck Auto check box to manually enter a smaller value. E.g., suppose the original graph uses Y column B&C. Column Offset = +2 and Number of Offsets = 3 duplicate the graph with new Y column D&E, F&G, and H&I. |
| X/Error Mapping Method | Select how to pick X or Error column for the duplicated plots.
|
| Match Modifiers by | Specify how to match the modifiers when the original graph uses grouping info to, e.g., map to symbol color, line style, or other plot attributes. The default selection follows the Match Modifiers by control in the Miscellaneous tab of Plot Details dialog.
Note that if Match Modifiers by = <Offset>, the specified Column Offset also applies to modifiers. If Match Modifiers by is set to a column label (e.g., Long Name or Comment), it will always map the plot attributes to the first eligible columns in the worksheet. |
Output Settings for New Plots
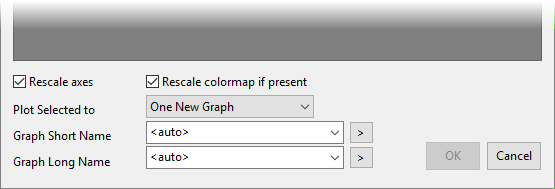
| Rescale axes | Check (default) to rescale axes to show the new added/created plots. Uncheck to use the axis scale of the original graph. |
|---|---|
| Rescale colormap if present | Check (default) to rescale colormap to show the full color range for new plots. |
| Plot Selected to | Specify where to output the new plots:
|
| Graph Short Name | Pre-define the Short Name for new graphs. Available when Plot Selected to is not set to Original Graph.
|
| Graph Long Name | Pre-define the Long Name for new graphs. Available when Plot Selected to is not set to Original Graph.
|
