11.13 The Vertical Cursor Gadget
 See more related video:Vertical Cursor Gadget
Use the Vertical Cursor gadget to read X and Y coordinate values for data points on stacked panel and multi-panel plots.
This gadget is available in the Gadgets menu when a graph window is active.
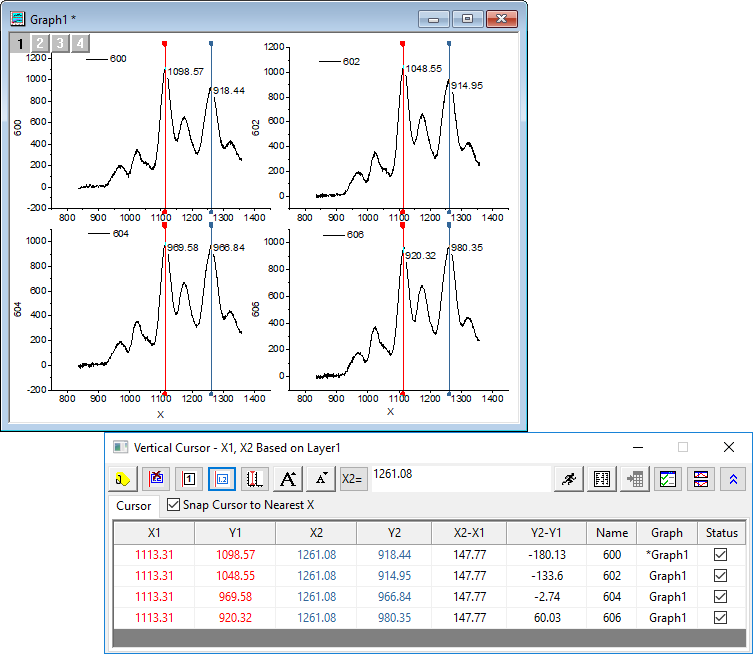
 | Since Origin 2021, a switching button Add Linked Cursor for Each Layer has been added to allow you add linked cursors to all layers and move the cursors simultaneously to read the XY coordinate in each layer of a multi-layer graph. |
Contents
The Gadget Dialog's Toolbar Buttons
| Add Tag and Label
|
Add tag and labels at current position for the selected plots, and the XY coordinate values of this tag will output to the result sheet.
If do not need this output when you click this button, click Options button to open Preferences dialog, uncheck Output Tags in Labels and Tags tab.
|
|---|---|
| Hide Label
|
Click this button to specify whether to hide the labels. Note: Only the X value will be tagged at the top/bottom of the graph while the labels are hidden. |
| Show All Info in One Label/Multiple Lables
|
Show information of all data plots into one label or each plot has its own label. |
| Add 2nd Cursor/Remove 2nd Cursor
|
Click this button to add second cursor. The difference between two cursors can be calculated and outputted. Click the button again to remove the second cursor |
Add Linked Cursor for Each Layer/Remove Linked Cursor for Each Layer  / /
|
Click this button to add or remove the linked cursor on each layer. If the second cursor has been added, there will be two linked cursors in each layer. |
| Increase/Decrease Font Size
|
Increase or decrease the font size of the labels. |
| Move Cursor to X
|
Move the cursor to the position specified by the input X value. |
| Output Report
|
Output the XY coordinate values listed in the Cursor tab to the specified worksheet. Note that pressing the O key also outputs the current values to a worksheet. |
| Go to Report Worksheet
|
Switch to the report worksheet. |
| Options
|
Open the Preference dialog. |
| Link/Unlink Graphs
|
Click this button to open the Graph Browser, to select and link graphs to the current graph. |
| Hide Details
|
Click this button to expand or hide the Cursor table. |


Data Points List
Snap Cursor to Nearest X
Select to snap the cursor to the nearest source data points in X direction.
Cursor Table
This table lists information about the intersection of the vertical cursor and data plots.
This table includes two context menus with which you can customize column and plot display.
Context Menu 1
Right-click a column header to open a menu which will let you select the columns to display in this table.
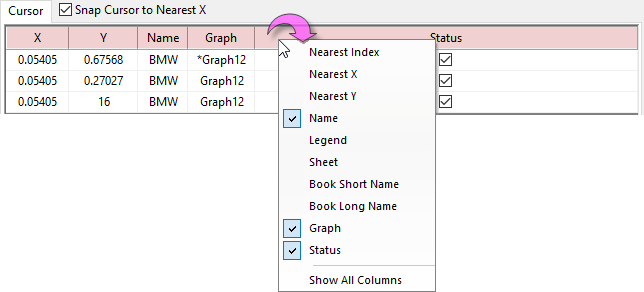
Note: Since Origin 2021b, the menu item Legend has been added into the list to let you choose whether show the Plot Legend in the table to distinguish the plots, in case that the plot names are same or similar.
Context Menu 2
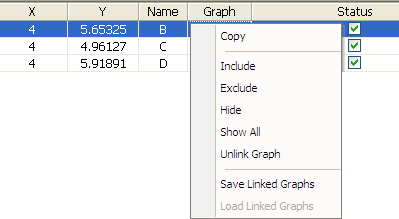
Right-click the area below the column header to open another menu. Here, you can select to copy data to the clipboard, choose which plots to display in the table, unlink the linked graph, and save/load linked graphs.
Preferences Dialog
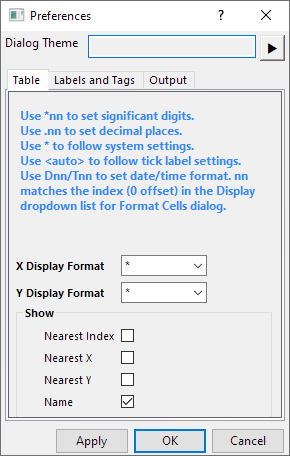
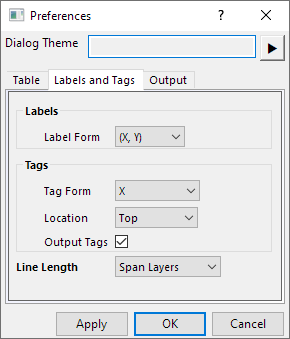
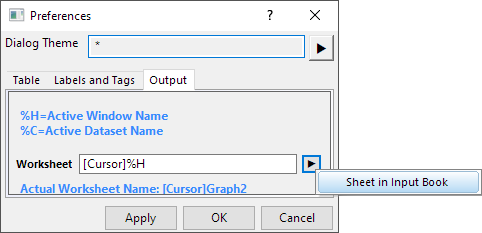
Click the Options button  to open the Preferences dialog. This dialog contains three tabs:
|
|
|
Table tab
On this tab, you can:
- Specify the display format of X and Y values in the Cursor table and in labels on the graph.
- Note that X/Y Display Format = <auto> will follow axis tick labels. For links to other Display Format syntax options, see this table.
- Select columns to display in the Cursor table.
Tags and Labels tab
On this tab,
- you can specify Label Form, Tag Form, and Tag Location.
- You may choose to customize the Label or Tag Form by writing a custom format string. For more information on string syntax, please refer to Substitution Notation in LabTalk Help.
- You can specify the line length, Span Layers or Full Page.
Output tab
Specify the output result worksheet:
- When you generate new output, results are output to a book and sheet named [%H-Cursor]Result by default, where %H is a string register storing the name of the active graph window. Other books and sheets can be specified. If the book and sheet do not exist, they will be created on output.
- Alternately, you can click the flyout button
 to the right of Worksheet and choose Sheet in Input Book. This fills the edit box with [<input>]%H. When you generate new output, this will add results to the source workbook (the book containing the plot data), in a sheet named for the graph window.
Link/Unlink Graph
When open the vertical cursor and add a tag on a graph, you can click the button  to open the Graph Browser and link the graphs together.
An additional button Load Last Used is available in the graph browser window for vertical cursor, by clicking this button, the graphs which are linked last time will be loaded and be ready to be linked.
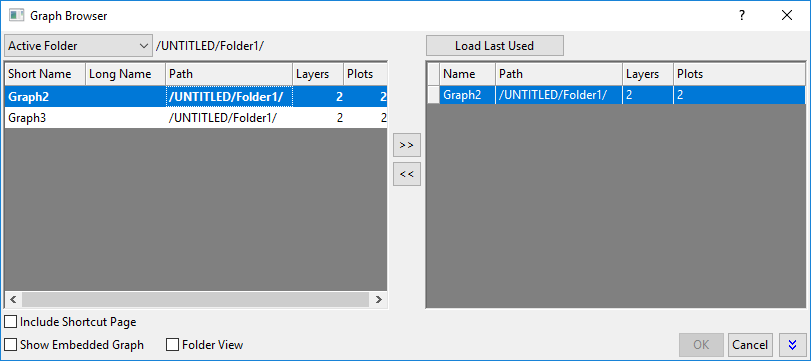
If the graphs are already linked, when the cursor is moved on one graph, data coordinates from all data plots and from each of the linked graphs will be displayed. Furthermore, when a tag is added to/deleted from the graph with the cursor, corresponding tag is added to/deleted from each of the linked graphs.
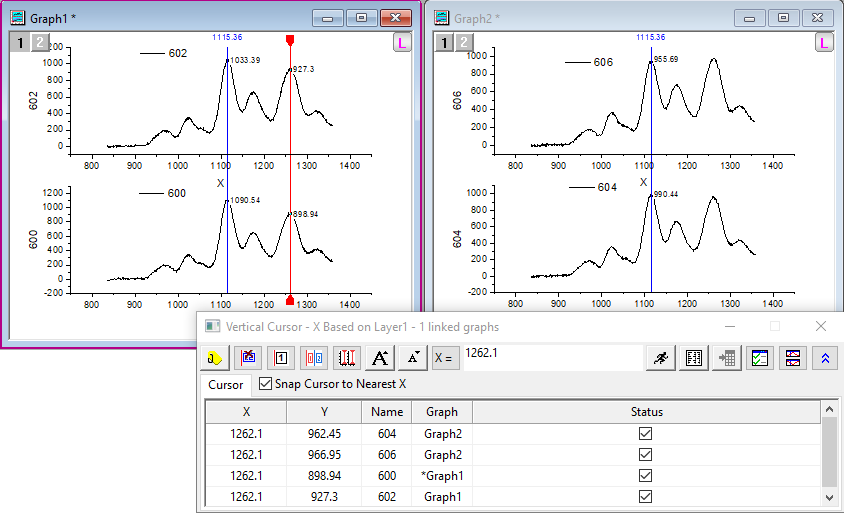
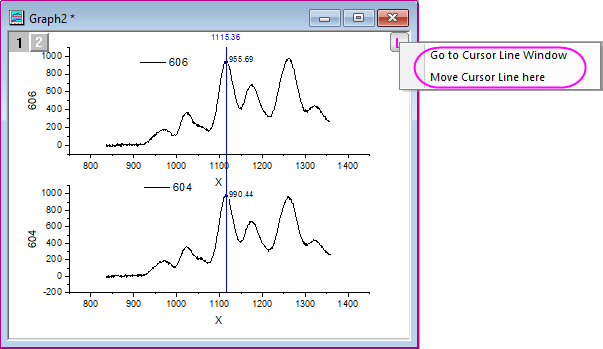
After the graphs have been linked together, an icon  will be added on top-right of all graphs to indicate which graphs have been linked together. Right-click this button, a context menu to control the cursor line will be brought up and you can:
- Go to Cursor Line Window:
- Directly active the graph window which the cursor line is currently on.
- Move Cursor Line here:
- Move the cursor line to the current active graph window.