![]() See more related video:Quick Peaks Gadget
See more related video:Quick Peaks Gadget
![]() See more related video:Quick Peaks Gadget
See more related video:Quick Peaks Gadget
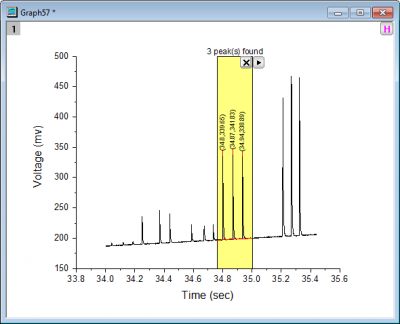
The Quick Peaks Gadget provides a quick and interactive way to perform peak analysis on data plotted in a graph. You can select an arbitrary range of the data plot using the region of interest (ROI) object displayed in the graph. Peak analysis results will update as the ROI is moved or resized.
With the Quick Peaks gadget, you can:
To use this tool, select Gadgets: Quick Peaks from the Origin menu, when a graph is active. If the tool has already been activated, you can re-open the Quick Peaks dialog by clicking on the arrow in the upper-right corner of the ROI and choosing Preferences.
To toggle the display of all gadget ROI boxes in a graph at the same time, click the H button ![]() in the top right corner of the graph, which enables users to export the graph with gadget results.
in the top right corner of the graph, which enables users to export the graph with gadget results.
| X Scale | Specify the X Data range for the ROI.
|
|---|---|
| Show Tool Name | Specify whether to show the tool's name near the top of the ROI. |
| Show Number of Peaks on Center-Top | Specify whether to show the number of peaks on center-top of the ROI. |
| Fill Color | Specify the filled color of the ROI. |
| Mode | Specify the baseline mode. Options include:
|
|---|---|
| Range | This is not available when the Mode is Straight Line. Specify how the baseline range shows on the ROI.
|
| Fix x to | This is only available when the Mode is Straight Line. Specify how the straight line end points are decided.
|
| Y Offset of Left | This is only available when the Mode is Straight Line. Specify the left end point offset on the Y axis scale. |
| Y Offset of Right | This is only available when the Mode is Straight Line. Specify the right end point offset on the Y axis scale. |
| Smoothing Method | Select smoothing method to create baseline. This option is only available when the Mode is set as 2nd Derivative.
|
| Maximum Anchor Points | Specify the maximum of baseline anchor points. This option is only available when you set Mode to 2nd Derivative. |
| Connected Method | Specify connect method for the anchor points. This option is only available when you set Mode to 2nd Derivative. |
| Constant | Use drop-down list to specify the intercept for the horizontal line to be used as the baseline.
|
| Y= | Specify the customized intercept for the horizontal line as baseline. This option is only available when Constant is Custom. |
| Dataset | Specify a dataset as baseline. This option is only available when Mode is set to Use Existing Dataset. |
| End Points(%) | Specify the percentage of end points to create baseline. This option is only available when you set Mode as End Points Weighted. |
| Direction | Specify whether or not to find peaks with a specified direction only.
| ||
|---|---|---|---|
| Peak Finding Settings | Specify the settings for finding peaks.
| ||
| Peak Filtering | Specify how to filter peaks.
| ||
| Peak Display |
Peak Marker: Whether to show peak marker.
Peak Label: Whether to show peak label.
Base Marker: Whether to show base marker. Note that when more than 100 peaks are found, no base marker will show even though it is checked.
| ||
| Tag Peak and Base as |
|
| Integration from |
Select how to integrate the peaks, from Beaseline or Y=0. |
|---|---|
| Show Integrated Area |
Select if show the integration area of found peaks in the ROI box. Note that when more than 100 peaks are found, no integration area will show even though it is checked. |
| Script Window |
Specify whether to output the results to the Script Window. |
|---|---|
| Results Log | Specify whether to output the result to the Results Log. |
| Append to Worksheet |
Specify whether to append the results to a worksheet. |
| Result Worksheet Name |
This is only available when Append to Worksheet is selected. It is used to specify the name of the worksheet.
|
| Tag Info Worksheet Name |
Specify the output sheet name to store the tag information. If on the Find Peak tab:
|
| Output Baseline to Worksheet |
Specify to output the baseline to worksheet. |
| Baseline Worksheet Name |
|
| Output Quantities | Specify what data to output.
|
|---|
| New Output | Output results to the specified worksheet (if not empty, append the results). |
|---|---|
| New Output for Entire Curve | Output results for all peaks in the active plot to the specified worksheet (if not empty, append the results). |
| New Output for All Curves (N) | Output the results for all curves in the current layer to the specified worksheet (if not empty, append the results). |
| New Output for All Layers (L) | Output the results for all curves in all layers within the current graph to the specified worksheet (if not empty, append the results). |
| Subtract Baseline | Subtract the specified baseline from source data in the ROI box. |
| Go to Report Worksheet | Activate the report worksheet, if there is one. |
| Output to Clipboard | When selected (menu item checked) New Output will be placed on the Clipboard. |
| Tag Peaks | Tag the found peaks and add the peak labels for found peaks as a label plot or data markers into the original graph. The labels will still exist even after closing the gadget. When the peaks are added as data marker, they can be used by the Multiple Peak Fit (menu is Analysis: Peaks and Baseline: Multiple Peak Fit) tool. |
| Fit Peaks | Fit the found peaks by specifying a fitting function. |
| Switch to Peak Analyzer | Switch to Peak Analyzer to fit the found peaks. More details about fitting peaks in Peak Analyzer, please refer to this help page. |
| Update Output | Update the output, and the original results will be clear, then add the current results. This is applicable only when you have output the peak values. |
| Change Data | Change the source data set. This is applicable only when there are multiple curves on the graph layer.
Please note, when you change the source data/target plot, the peak markers and peak labels of found peaks will automatically show on the newly-selected plot, following the settings in the Find Peaks tab. If you need keep the peak markers and labels on current plot, please select Tag Peaks from the fly-out menu. |
| Expand to Full Plot(s) Range | Expand the ROI box to full plot range. |
| Fix ROI Position | Fix the ROI position, then you cannot move it any more. |
| Save Theme | Save theme for the dialog settings. |
| Save as <default> | Save the current dialog settings as default theme. |
| Load Theme | Load the existed theme to apply the dialog settings. |
| Preferences | Open the Quick Peaks Preferences dialog, which is similar with the one when starting the gadget by selecting menu Gadgets: Quick Peaks. |
dx}{\int_{0}^{\infty}F(x)dx}")
 , this line will intercept with the input data at two points. Let's denote them as
 ") and
and ") , where
, where  . Also, we denote the peak center as
 ") . Then we can compute the left half width as:
. Then we can compute the left half width as: 
