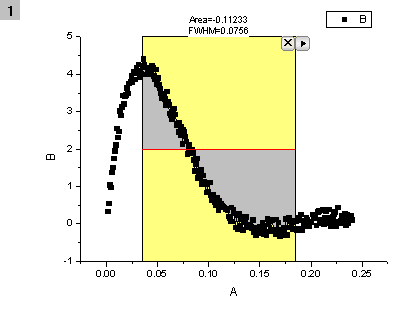
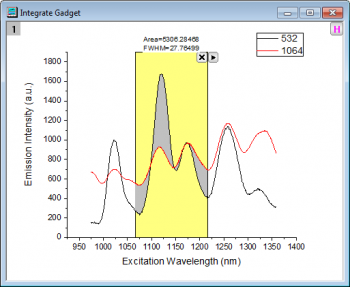
The Integrate Gadget tool (the addtool_curve_integ X-Function) allows you to select an arbitrary range of data on a graph intuitively, using the region of interest (ROI) object (yellow rectangle). Then the tool performs integration on the chosen section to calculate the area under the curve and display the results instantly on top of the ROI.
With this Gadget, you can:
To use this tool, select Gadgets: Integrate... from the Origin menu when a graph window is active. If the tool has already been activated, you can re-open the Integrate dialog by clicking on the arrow in the upper-right corner of the ROI and choosing Preferences.
To toggle the display of all gadget ROI boxes in a graph at the same time, click the H button ![]() in the top right corner of the graph, which enables users to export the graph with gadget results.
in the top right corner of the graph, which enables users to export the graph with gadget results.
| X Scale | Specify the X Data range for the ROI.
|
|---|---|
| Show Tool Name (toolname) | Specify whether to show the tool name at the top of the rectangle in the graph. The tool name can be specified in Preferences. |
| Fill Color (rectcolor) | Specify the color of the rectangle that attaches to the graph. See the list of colors. |
| Show Area/FWHM on Center-Top (showtop) | Specify whether to show the integrated area and FWHM of the selected section at the top of the rectangle in the graph. |
| Fit Limits To (fitlimit) | Specify the integration limits. You can get the limits through linear interpolation/extrapolation or use raw data points as integral limits.
|
|---|---|
| Area Type (areatype) | Specify the integral area type.
|
| Show (showIntegrArea) |
|
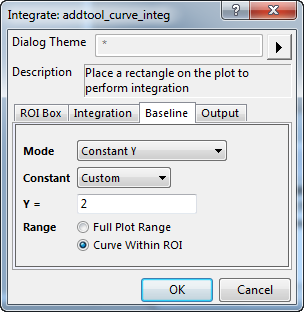
| Method (method) | Specify a baseline mode.
|
|---|---|
| Y= (yvalue) | This is only available when Constant Y is selected for Method. You can use it to specify the Y value for the horizontal line to be used as the baseline. |
| Fix x to (fixxto) | This is only available when Straight Line is selected for Method. It works together with Y offset of left (yoffsetleft) and Y Offset of Right (yoffsetright). It is used to specify how to choose X values for the beginning and end of the baseline.
Now, suppose we define the value of Y offset of left (yoffsetleft) as b1 and Y offset of right (yoffsetright) as b2; the beginning Y value of the baseline as a1, and the ending Y value as a2. Then we always have a1-b1=y1 and a2-b2=y2, where y1 and y2 are the Y values at x1 and x2, respectively. For how to define x1 and x2, see below.
|
| Y Offset of Left (yoffsetleft) | This is only available when Straight Line is selected for Method. It used to set the value of b1 mentioned above. |
| Y offset of Right (yoffsetright) | This is only available when Straight Line is selected for Method. It used to set the value of b2 mentioned above. |
| Baseline Dataset (xyrbase) | This is only available when Dataset is selected for Method. It is used to specify an existing data set to be used as the baseline.
Range 1 (Range1)
|
| Smoothing Method | Select a smoothing method to apply smoothing prior to creating the baseline. This option is only available when the Mode is set as 2nd Derivative. Options include:
|
| Maximum Anchor Points | Specify the maximum of baseline anchor points. This option is only available when you set Mode to 2nd Derivative. |
| Connected Method | Specify connect method for the anchor points. This option is only available when you set Mode to 2nd Derivative. |
| End Points(%) | Specify the percentage of end points to create baseline. This option is only available when you set Mode as End Points Weighted. |
Customize the output results.
| Script Window (script) | Specify whether to output the results to the Script window. |
|---|---|
| Results Log (reslog) | Specify whether to output the result to the Results Log. |
| Long Name in Results Log/Script Window (useLongName): | Specify whether to use the long names of the Quantities (quantities) or the variable names of them when Origin outputs the results to the Results Log or Script window. |
| Append to Worksheet (appendwks) | Specify whether to append the results to a worksheet. |
| Result Worksheet Name (wbkName) | This is only available when Append to Worksheet (appendwks) is selected.
|
| Add Label to Graph (LabelToGraph) | It is used to specify whether output the label to the graph. |
| Significant Digits(signdigits) | It is used to specify the significant digits of output quantities. The default system follows the Digits settings on the Numeric Format tab of Preferences: Options dialog. It effects labels on the top of ROI box and the outputs to Script Window, Results Log and labels added to graph. |
Specify the quantities to be outputted.
| Dataset Identifier (name) | Specify a dataset identifier in the drop-down list. |
|---|---|
| Beginning Row Index (begin_row) | Specify whether to output the beginning row index. |
| Ending Row Index (end_row) | Specify whether to output the ending row index. |
| Beginning X (begin_x) | Specify whether to output the beginning X value. |
| Ending X (end_x) | Specify whether to output the ending X value. |
| Max Height (ph) | Specify whether to output the maximum height, as computed from the baseline. |
| X at YMax (pc) | Specify whether to output the X value at the maximum Y value. |
| Area (pa) | Specify whether to output the area, as computed from the baseline. |
| Area Above Baseline (paa) | Specify whether to output the area above the baseline. |
| Area Below Baseline (pab) | Specify whether to output the area below the baseline. |
| Centroid (pcd) | Specify whether to output the centroid. |
| FWHM (pfwhm) | Specify whether to output the FWHM (the full width at half the height of the source curve). |
| Left Half Width (plhw) | Specify whether to output the left half width. |
| Right Half Width (prhw) | Specify whether to output the right half width. |
| Y Max (pymax) | Specify whether to output the Y value on the input curve at the X position where the Y on subtracted curve has the maximum absolute value. |
| Index of X at YMax (pxofymax) | Specify whether to output the index of X for the Y Max value. |
| Baseline (base) | Specify whether to output the baseline information. |
| Notes: The name in the brackets is the tree node name, and the name outside is the tree node label. When an X-function executes by script, you have to assign values to tree nodes using their names. Special characters and spaces are not allowed in tree node names. However, you can use special characters and white space in the tree node label. |
Specify whether output the created baseline, integrated curve or/and subtracted curve of the selected range under the ROI box.
| Baseline (base) | Specify whether to output the baseline information. |
|---|---|
| Integral Curve(Integrated) | Specify whether to output the Integral Curve. |
| Subtracted Curve(Subtracted) | Specify whether to output the Subtracted Curve(gotten by subtracting selected baseline from the source curve) if the Baseline Mode is not None. |
| Output To (Outputto) | Specify where to output the result:
|
Click the triangle button ![]() near the top right corner of the ROI to open a fly-out menu that offers the following options:
near the top right corner of the ROI to open a fly-out menu that offers the following options:
| New Output | Output the result. |
|---|---|
| New Output for All Curves (N) | Output the results for all curves in the current layer to the specified worksheet (if not empty, append the results). |
| New Output for All Layers (L) | Output the results for all curves in all layers within the current graph to the specified worksheet (if not empty, append the results). |
| Update Last Output | Update the last output. Only available when there is already an output. |
| Go to Report Worksheet | Go to the report worksheet once the result has been output to worksheet. |
| Go to Source Worksheet | Go to the source worksheet |
| Output to Clipboard | When selected (menu item checked) New Output will be placed on the Clipboard. |
| Change Data | Change the input data.
|
| Expand to Full Plot(s) Range | Expand the ROI box to the full Plots range. |
| Fix ROI Position | Fix the position of ROI box. |
| Save Theme | Save the settings in this dialog as a dialog theme. |
| Save as <default> | Save the setting in this dialog as <default> theme. |
| Load Theme | Load the dialog theme pre-saved. |
| Preferences | Open the Preferences dialog. |
To perform integration on an area of a graph with the baseline at y=2, do the following: