11.7 The Differentiate Gadget
Gadget-Differentiate
Overview
The Differentiate Gadget provides a convenient way to calculate and display the derivative curves in the ROI (Region of Interest) range.
With this gadget, you can:
- Move and resize the region of data to differentiate.
- Specify the desired derivative order.
- View the derivative curve alongside a graph of the data.
- Output the derivative curve to a worksheet.
To Use Differentiate Gadget
To use this tool, select Gadgets: Differentiate from the Origin menu, when a graph is active.
Dialog Settings
This dialog can be opened from the Origin menu, under Gadgets: Differentiate, or you can select Preferences from the ROI fly-out menu.
| ROI Box
|
Show Tool Name
- Specify whether to show the tool's name near the top of the ROI.
Fill Color
- Specify the ROI fill color.
Derivative Line Color
- Specify the line color of the derivative curve.
|
| Derivative Order
|
Specify the derivative order. Besides this option, you can also bring up the first and second derivative curves from the fly-out menu of the ROI tool.
|
| Smooth
|
Savitzky-Golay Smooth
- Check this check box to apply Savitzky-Golay smoothing, which performs a local polynomial regression around each point to find the derivatives.
Polynomial Order
- Specifies the polynomial order for Savitzky-Golay smoothing. Note that this value cannot be smaller than the derivative order.
Points of Window
- Specifies the number of points in the moving window used in the Savitzky-Golay smoothing.
|
The Fly-Out Menu
Click the triangle button  near the top right corner of the ROI to open a fly-out menu that offers the following options:
| Delete ROI and Leave Derivative Graph
|
This option will close the differentiate tool but keep the derivative curves window.
|
| Keep Derivative Graph when Close ROI
|
Specify whether to delete the derivative curve window if you close the tool by clicking the "x" button in the top right corner of the ROI.
|
| Change Data
|
Change fitting data/plot. By default, all plots in current layer will be selected.
- Clear the check mark in front of All Plots to deselect all.
- Place a check mark in front of any plot to select that plot.
- Click Select... or More ... to open the Select Plot(s) dialog and select multiple plots.
- When Auto is enabled, plot selection is controlled by clicking on a plot in the graph window or Object Manager.
|
| Expand to Full Plot Range
|
Expand the ROI to the full plot range.
|
| Show 1st/2nd Derivative
|
Show the first or second derivative curve.
|
| Save Theme
|
Save the settings as a theme.
|
| Load Theme
|
Load theme settings.
|
| Preferences
|
Open the Differentiate Preferences dialog.
|
Example
- Create a new worksheet and import the data HiddenPeaks.dat from the folder <Origin Program Folder>\Samples\Spectroscopy. Highlight Column B and click
 on the 2D Graphs toolbar to create a line plot.
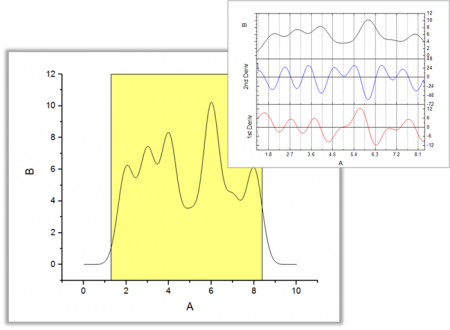
- Select Gadgets: Differentiate from the Origin menu to open the settings dialog of the tool. Select 2 for Derivative Order. Keep the other default settings and click OK. A yellow ROI region is added to the plot, and a Preview window is created to show both the source and derivative curves.
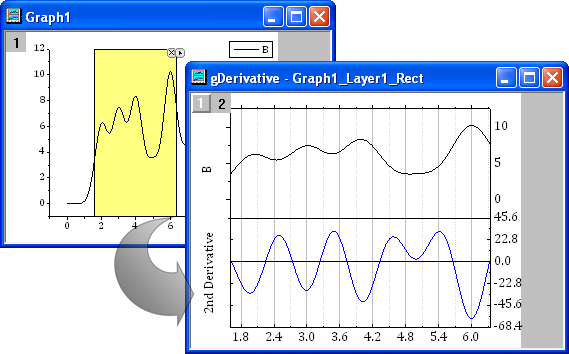
- Move the ROI and see how the derivative curve changes.