32.1.100 GaddumSchildShift
Contents
Function
\[y = Bt + \frac{Tp-Bt}{1+\left(\left(\left(\frac{B}{10^{-p}}\right)^{SS}+1\right)\left(\frac{EC50}{x}\right)\right)^{HS}} \]
Brief Description
Gaddum/Schild EC50 shift for x is concentration.
Sample Curve
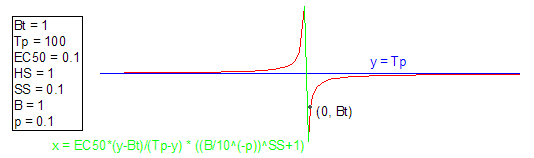
Parameters
Number: 7
Names: Bt, Tp, EC50, HS, SS, B, p
Meanings: Bt=lower plateau, Tp=Tpupper plateau, EC50=concentration in halfway, HS=Hill slope, SS=schild slope, B=antagonist concentration, p=negative logarithm of A2
Lower Bounds: none
Upper Bounds: none
Derived Parameters
logEC50=log(EC50)
logA2=-p
Script Access
nlf_GaddumSchildShift(x,Bt,Tp,EC50,HS,SS,B,p)
Function File
GaddumSchildShift.fdf
Category
Dose Response