31.12.4 Fill Area Graph
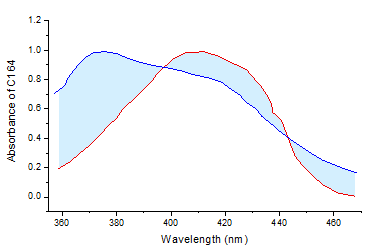
Data Requirements
Select at least two Y columns of values (or a range from at least two columns). If there is an associated X column, X column supplies X values; otherwise, sampling interval of the Y column or row number is used.
Creating the Graph
Select required data.
From the menu, select .
or
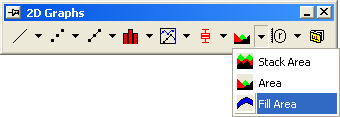
Click the Fill Area button on the 2D Graphs toolbar.
Template
FILLAREA.OTP (installed to the Origin program folder).
Notes
The area between the data plots (the two Y columns) is filled, by default only one fill pattern will be used. You can go to the Line tab of the Plot Details dialog to change the fill area mode to Fill to data plot - Above Below Colors, and then you can customize two different patterns. This will be useful if there are intersection point(s) for the two Y curves and the intersection points are not only at the X boundaries.
Fill Area plot supports filling with colormap. Double click on the graph to bring up Plot Details dialog box, expand Layer1 node and highlight the first sub-node. Then go to Pattern tab page, under Fill panel select Color Mapping from Color drop-down list and the corresonding Colormap and Numeric Formats tabs will show up. You can customize the colormap settings in the Colormap tab.