18.4.1.1 The FFT Dialog Box
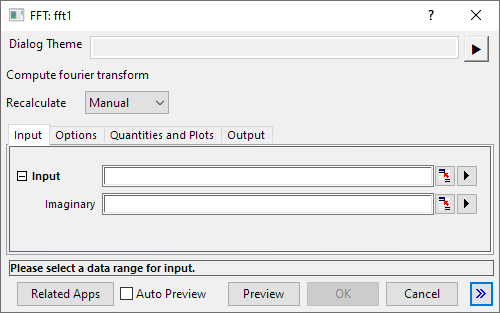
- Menu Command: Analysis: Signal Processing: FFT: FFT
- Window Types: Workbook, Graph
- X-Function Script and GUI Examples: fft1
Common Controls
| Dialog Theme | See Dialog Themes. |
|---|---|
| Recalculate |
Input tab
| Input |
Specifies the input signal, which could be complex. The real and imaginary parts of the signal can be saved in different columns or in the same column. The default is <Active>, which corresponds to the active dataset. |
|---|
Options tab
| Sampling Interval |
Specifies the sampling interval. The default is <Auto>, which corresponds to an automatically-computed interval. Please see the algorithm section for details. |
|---|---|
| Window |
Specifies the type of window used to suppress frequency leakage.
For more information, see Algorithms, FFT |
| Window Correction |
Specifies the Window Correction Factor used to correct the alteration made by applying a window to the input data.
|
| Normalize Re, Im, and Mag |
Specifies whether to normalize the complex, real, imaginary, magnitude, and square magnitude output. The default is false. Note that other outputs such as amplitude are not affected by this variable. Please see the algorithm section for details. |
| Shift |
Specifies whether the result should be rearranged so that the lower frequency components are in the center. |
| Unwrap phase |
Specifies whether the phase should be unwrapped. |
| Factor |
Specifies whether the Electrical Engineering or Science convention is used to set the sign of the Exponential Phase factor.
|
| Spectrum Type |
Specifies the Nyquist interval over which power is calculated.
|
| Normalize power to |
Specifies the power density normalization method. Please see the algorithm section for details.
|
| Preview |
Specifies the preview content in the dialog. |
Quantities and Plots tab
Select check boxes to create output of the following components of the FFT results:
Real, Imag, Amplitude/Phase, Phase, Power/Phase, Real/Imag, Magnitude, Amplitude, Power, dB, Normalized dB, RMS Amplitude, Square Amplitude, Square Magnitude.
Output tab
See Output Results.
| Result Data Sheet |
Specifies the worksheet sheet for outputting the result data. |
|---|---|
| Result Graph Sheet |
Specifies the sheet for outputting the result graphs. |