31.5.7 Doughnut with Total Wedges = 100
Data Requirements
Select exactly one Y column of values (or a range from one column).
Creating the Graph
Select required data.
From the menu, choose .
Template
DonutTranspose.OTP (installed to the Origin program folder).
Notes
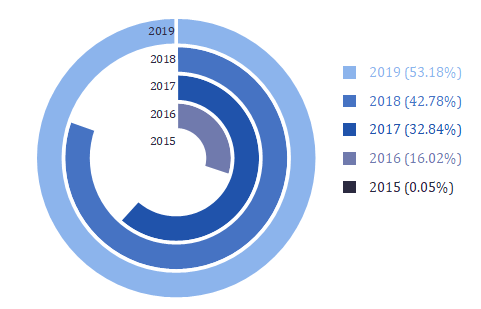
The Doughnut with Total = 100 chart, also known as "Progress Doughnut Chart", is a very popular way to measure progress towards a goal or target.
This doughnut plot(with total =100) can be plotted from a value or a dataset/column, each selected value will be plotted into a separate circle as one wedge in percentage of the specified total value. To some extent, you could think that this kind of doughnut plot is a arc column/bar chart which shows the percentage of the task progress, relative to the whole task.
But for a general doughnut plot, each dataset/column will be plotted as a full circle with multiple wedges in percentage of the sum of the dataset/column.
Reference
To customize the viewing angle, rotation,radius and center, see The (Plot Details) Pie Geometry tab.
To customize the wedges, such as exploding and combining the wedges, see The (Plot Details) Wedges Tab.
To customize the labels of wedges, see The (Plot Details) Labels tab.