31.5.9 Doughnut with Different Radius Chart
Data Requirements
Select exactly one Y column of values (or a range from one column).
Creating the Graph
Select required data.
From the menu, choose .
Template
BarofPie.OTP (installed to the Origin program folder).
Notes
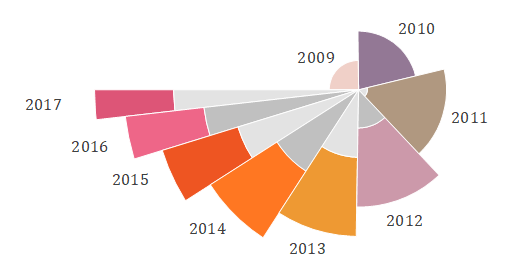
The Doughnut Plot with Different Radius, evolved from the Pie with Different Radius Chart, is also a variation of 2D Pie chart, which has incremental radius for each wedge and a specified Wedge Thickness.
To connect the outer doughnut wedges with the doughnut center, the inner slices will be filled with two alternate colors by default.
Reference
To customize the viewing angle, rotation,radius and center, see The (Plot Details) Pie Geometry tab.
To customize the wedges, such as exploding and combining the wedges, see The (Plot Details) Wedges Tab.
To customize the labels of wedges, see The (Plot Details) Labels tab.