31.5.6 Doughnut Of Pie
Data Requirements
Select exactly one Y column of values (or a range from one column).
Creating the Graph
Select required data.
From the menu, choose .
Template
DoughnutofPie.OTP (installed to the Origin program folder).
Notes
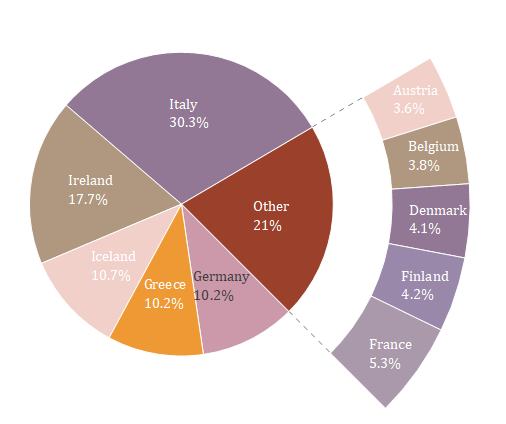
A doughnut of pie plot is also a variation of 2D pie chart just like the pie of pie chart, which has one pie chart and one doughnut chart connected by two straight lines:
- The pie chart is the main chart, shows whole component distribution in percentages including the wedge "Other" which is the sum of combined wedges.
- The doughnut chart is the child chart, shows the detailed information of the combined wedges of the wedge "Other".
If you have a 2D pie chart, want to plot a doughnut of pie chart:
|
Reference
To customize the viewing angle, rotation,radius and center, see The (Plot Details) Pie Geometry tab.
To customize the wedges, such as exploding and combining the wedges, see The (Plot Details) Wedges Tab.
To customize the labels of wedges, see The (Plot Details) Labels tab.