31.6.2 Double-Y Column Graph
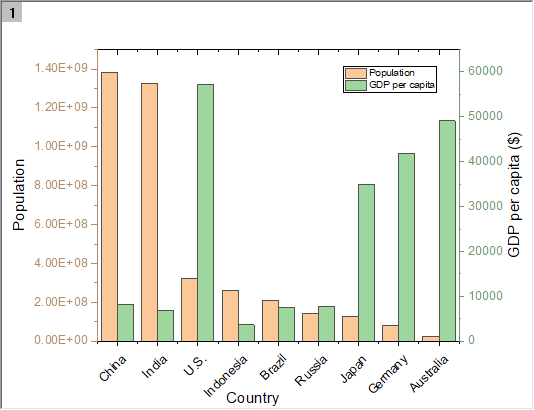
Data Requirements
Select at least one Y column (or a range from at least one Y column). Ideally, select two Y columns (or a range of two Y columns). If there is an associated X column, X column supplies X values; otherwise, sampling interval of the Y column or row number is used.
Creating the Graph
Select required data.
Select from the main menu.
Template
DblY_Col.OTP (installed in the Origin program folder).
Notes
This graph type has one layer only and 2 Y axes with different axis scale, same as the double Y axis Graph. In this graph, all Y column(s) will be plotted as columns, no matter which Y axis they are basing on.
- This is a single-layer graph template with two independent vertical (Y) axes.
- The Axis dialog Show tab Rescale Each Axis Independently box is checked.
- The template has the same data requirements and produces the same graph as the two-layer 2Ys Column.
- If an even number of columns greater than 2 (Y columns) is selected, datasets are plotted in alternate fashion against the left, then the right, vertical axes.