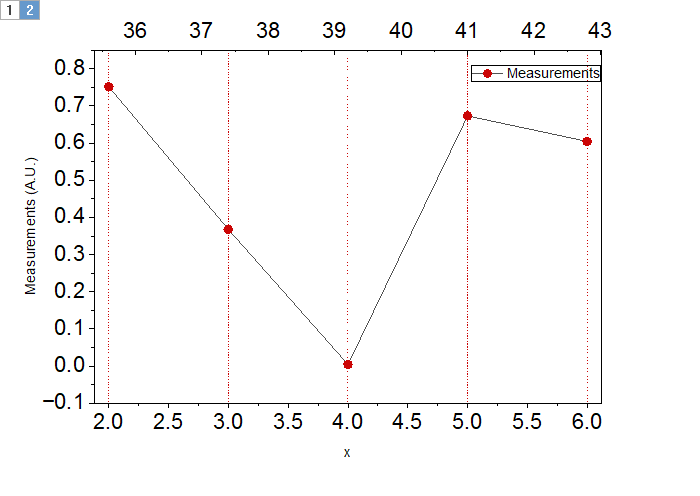
Select at least XY columns to create a Double X plot, where the 2nd X axis is functionally mapped to the first.
Ideal for displaying data in different units, such as temperature (°C/°F/K), wavelength and wavenumber.
Select required data.
Select from the main menu.
A dialog will pop up to let you set the secondary axis:
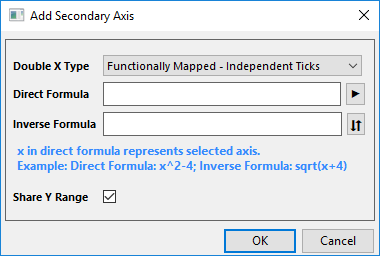
There are two method to functionally mapped the double X axes: Independent Ticks and Share Ticks.
dxcform.otpu (installed in the Origin program folder).
This graph contains two layers if you select Functionally Mapped - Independent Ticks as Double X Type, the secondary X axis will be added to the second layer. If you selected Functionally Mapped - Share Ticks, only one layer will be plotted with both bottom X axis and Top X axis which share tick position and with different tick labels related to the specified formula.
| Minimum Version: Origin 2026 |