29.2 Statistics and Analysis in Data Table
Contents
Analysis in Data Table
Most analysis tools are accessible from Analysis main menu.
Some table types, such as XY and Column tables, provide quick access to frequently-used analysis such as normalization and regression.
Statistics in Data Table
Most statistics tools are accessible from Statistics main menu.
For following frequently-used tools for Grouped and XY Table, Life Science Mode provides a quick-start dialog and auto-selects the appropriate input data to simply your analysis workflow. The full-featured dialog will then open, giving you complete control while streamlining your workflow.
One-Sample t-Test
- Select menu Statistics: Hypothesis Testing: One-Sample t-Test.
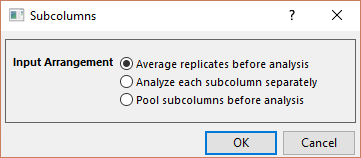
- Choose input data arrangement from the open dialog:
Average replicates before analysis Average values in each row, then perform the analysis on the averaged values. Analyze each subcolumn separately Perform the analysis independently for each subcolumn. Pool subcolumns before analysis Stack all subcolumn values, then analyze them as one sample.
Refer to this page for full controls OF One-Sample t-Test.
Two-Way ANOVA
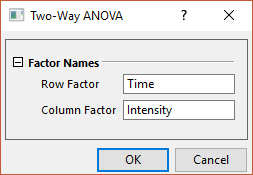
- Select menu Statistics: ANOVA: Two-Way ANOVA.
- In the open dialog, give a name to row-wise and column-wise factor, respectively.
Refer to this page for full controls OF Two-Way ANOVA.
Two-Way Repeated Measures ANOVA
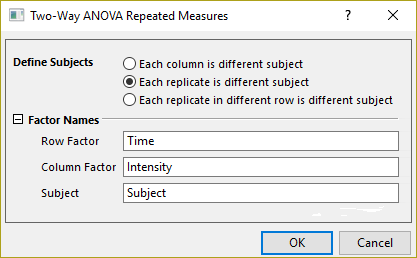
- Select menu Statistics: ANOVA: Two-Way Repeated Measures ANOVA.
- In the open dialog,
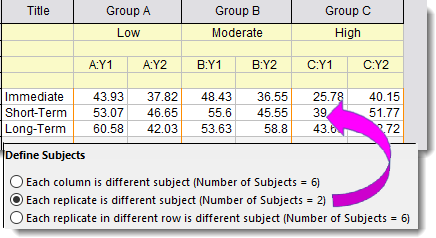
Define Subjects Specify how to define subjects. Number of Subjects shows inside parenthesis for comfirm. Factor Names Give a name to row-wise and column-wise factor, respectively.
Refer to this page for full controls OF Two-Way Repeated Measures ANOVA.Three-Way ANOVA
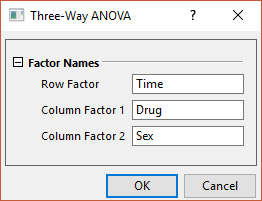
- Select menu Statistics: ANOVA: Three-Way ANOVA.
- In the open dialog, give a name to three factors respectively.