8.8.2 Labeling Plots using the Annotation Tool
For global labeling of 2D plots (also labeling of individual data points), see Labeling Plots using Label tab or Mini Toolbars.
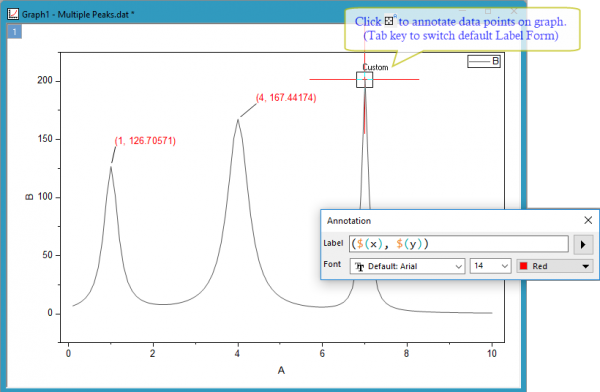
For precise picking and labeling specific points on 2D and Contour plots, you can use the customizable Annotation tool.
 | Another way to selectively label data points is by using Plot Details controls for Show at Specified Points Only. |
Creating a standard annotation
- Click on the Annotation button
 on the Tools toolbar. (2025b)You can use the Labtalk command
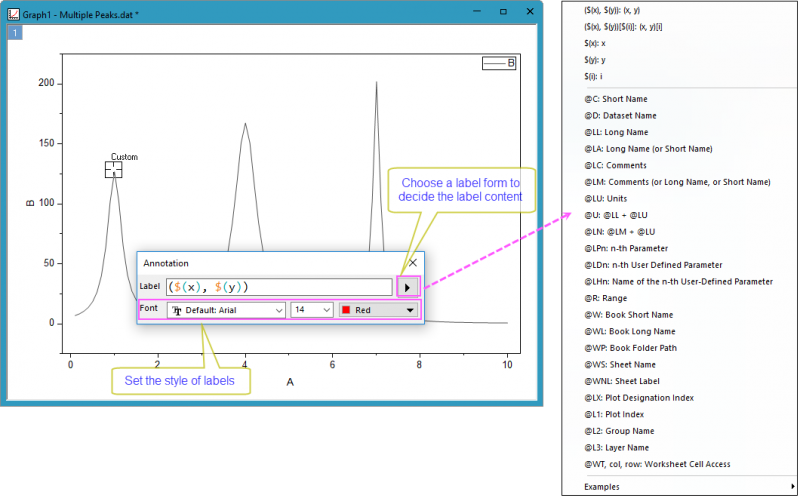
 dotool 100to start the annotation tool in graph. - In the opened dialog Annotataion which shows up with the annotation cursor, you can choose the label form, font, font size and font color for the labels you are going to add.
- Hover on the graph window and you can use the TAB key to toggle between annotation options (options visible on the Annotation cursor or on the Status bar at the lower-left side of the workspace).

2D XY data plots:
Annotation Form Cursor ($(x), $(y)) or other custom form 
(X coordinate value, Y coordinate value) 
(X coordinate value, Y coordinate value) [index number] 
X coordinate value 
Y coordinate value 
Index number (row number) 
Contour plots:
Annotation Form Cursor ($(x), $(y), $(z)) or other Custom Form
(X coordinate value, Y coordinate value, Z coordinate value) 
(X coordinate value, Y coordinate value, Z coordinate value) [Row index number] 
(X coordinate value, Y coordinate value, Z coordinate value) [Row index number] [Column index number] 
X coordinate value
Y coordinate value
Z coordinate value 
Index number (row number)
(Index number (row number),Index number (column number)) 
| When you select a data point of a data plot, you can click on the data plot, and then press ← and → on keyboard to cycle among data points. |
Editing an annotation
Pre-define the style and label form of annotations
Once you clicked the Annotation button , a mini dialog Annotation will show up to let you choose a label form and set the styles of the labels.
customize an existing annotation
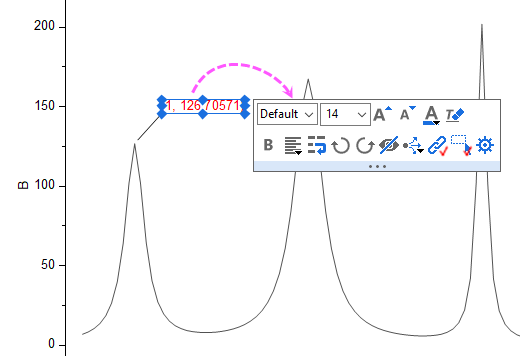
To customize an existing annotation, you can use the Mini toolbar or Properties… dialog:
Using Mini Toolbar
Using Properties… dialog
Right-click on the label and select Properties…. This opens the Annotation dialog box:
- As any other text objects, you can edit and format the text of the annotation in Text tab and its frame and background in Frame tab.
- The leader line is a line object attaches an annotation object to its data point. If you want change the style of a leader line, go to Leader Line tab.
Using Other Controls
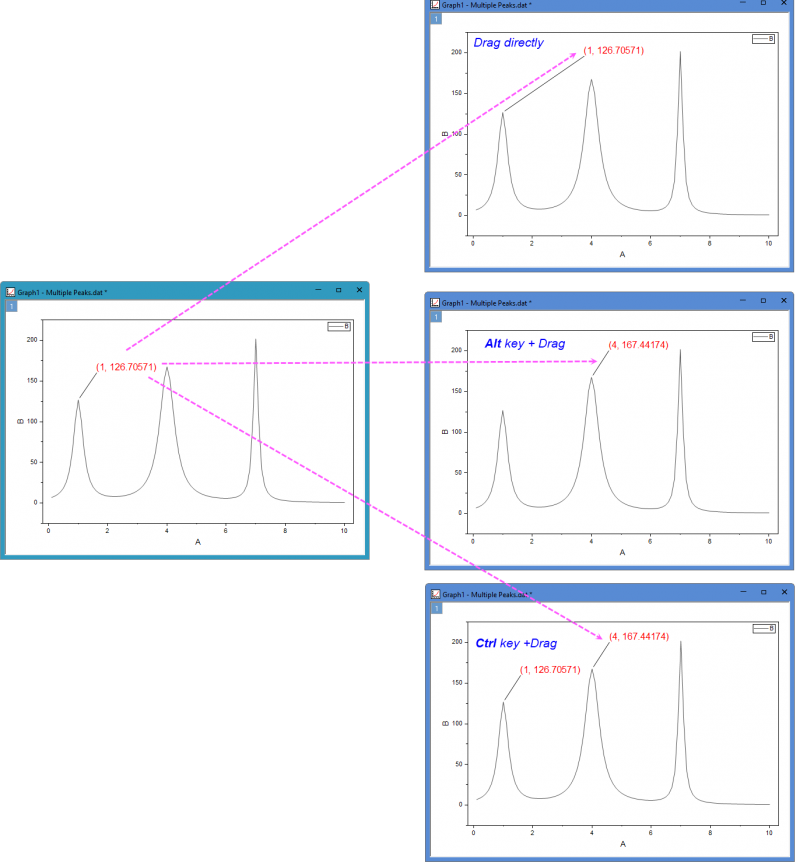
- Once an annotation object is created, you can drag it anywhere in the graph page, and the leader line connecting the label to the data point will follow.
- You can move an annotation object to another data point by pressing the ALT key and dragging the object to a new data point. The label will update automatically.
- Hold down the Ctrl key and drag the annotation object to another location to create a copy of the object at that new position. You can use this method to easily add more objects.
Custom annotations
In addition to the standard annotations and predefined custom annotation in the list, you can add a single custom annotation string that can incorporate arbitrary text and LabTalk variables in the Label box and then add the annotation. Or you can add an standard annotation firstly, and then right-click it to open the Annotation dialog box to customize the label content in Text tab.
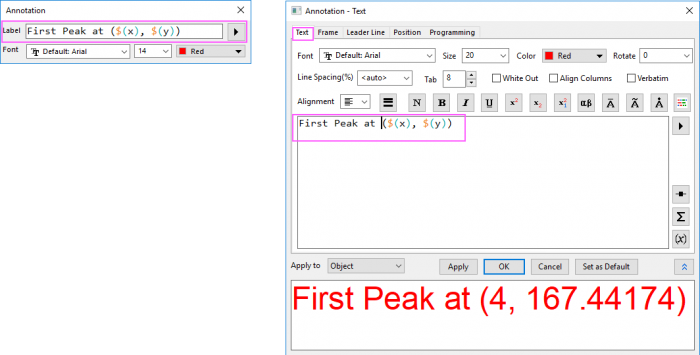
Example 1: Show Formula-Adjusted value as Annotation
In this example, we will use the Axis dialog box Formula box to create a custom tick label, then customize the Annotation tool to display the "formula" value instead of the actual value of the Y axis:
- Start with a fresh worksheet, select both columns then right-click and Fill Columns with Random Numbers.
- Click the Scatter button
 on the 2D Graphs toolbar.
 - Double-click on the Y axis labels and in the Axis dialog box Display tab, enter
x*piinto the Formula box and click OK. Note that the Y axis tick labels are now adjusted to display your according to the entered formula. - Click on the Annotation tool , select any point and double-click on the point to add an annotation label.
- Select the Pointer tool
 , right-click on the label and choose Properties.
 - In the text box, enter the string
$(x), $(y,y)and click the Set as Default button before you OK out of the dialog box. Note that the label now properly displays the formula-adjusted value of the Y axis and if you want to show the label in the Y axis major tick label format, you can enter$(x), $(y,yt). - Reselect the Pointer tool then press the ALT key and drag the custom label to another data point in the graph. Note that the annotation label updates with the new point coordinates.
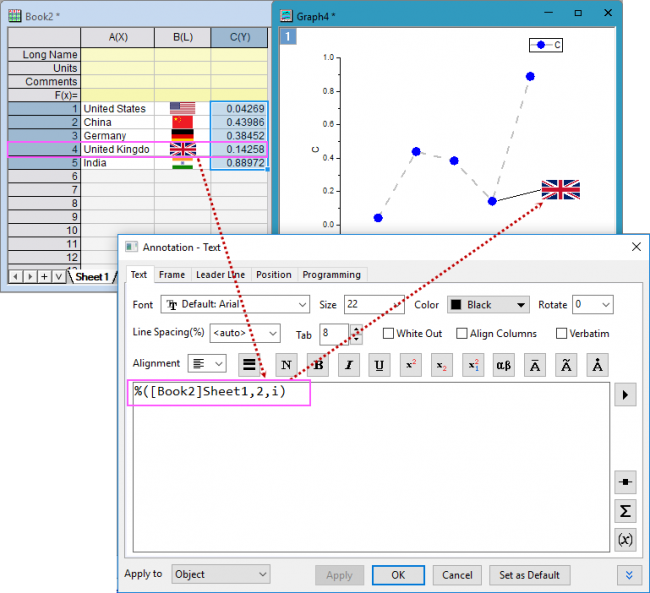
Example 2: Show Image as Annotation
Besides annotating the points with cell values or strings, you are also allowed to show embedded images as annotation labels.
| Labels created with the Annotation tool are text objects that use substitution to display a numeric value, a text string or an embedded image; As such, they support customizations beyond those discussed here. For more information, see Notations and syntax used in labeling plotted data and Text Label Substitution, both in the LabTalk Programming Guide. |