17.2.13 Creating Multiple Comparisons Plot
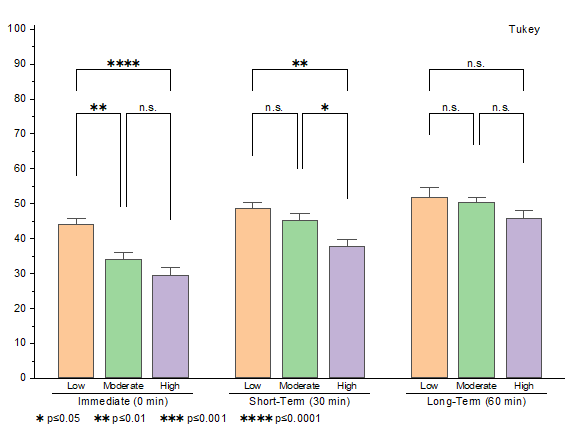
Multiple Comparisons plot is a data visualization and analysis method used to show differences, rankings, or statistical significance between groups or pairs of items.
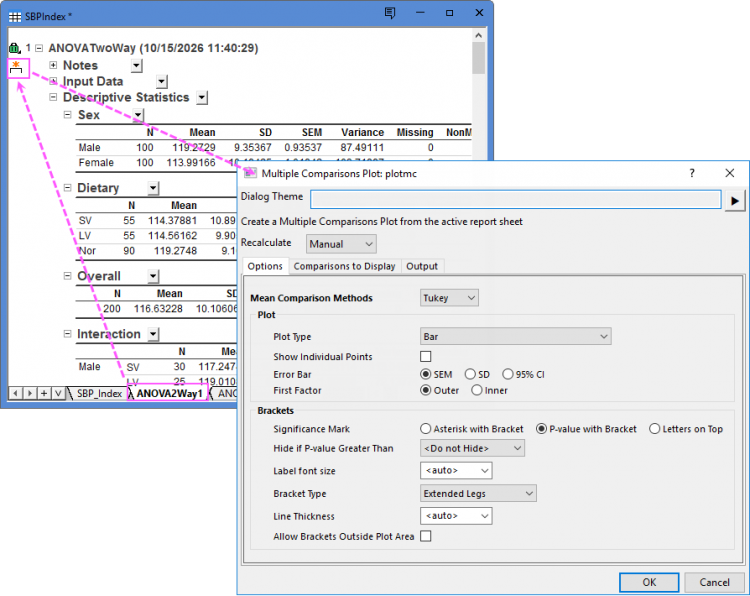
In many statistical tools, after performing the analysis, you can go to the report sheet, click the Create Multiple Comparisons Plot icon  to open the Multiple Comparisons Plot dialog and create the Multiple Comparisons plot.
Contents
Dialog Controls
Options tab
| Mean Comparison Methods | Choose a method to compare the means. Origin provides eight different methods for means comparison, such as for ANOVA, they are Tukey, Bonferroni, Dunn-Sidak, Fisher LSD, Scheffe, Holm-Bonferroni, and Holm-Sidak.
Note: For multiple conparison plot from the results of Two-way RM ANOVA, Origin does not currently support the method Dunnet. |
|---|---|
| Plot Type | Choose a plot type for Paired Comparison plot to show the groups or subgroups.
|
| Show Individual Points | When you choose Bar or Box as Plot Type, you can decide whether show the individual plots on the bars or boxes. For other plot types, the individual plots will be shown by default. |
| Error Bar | For the plot type Bar, Box, Scatter and Scatter and Line, you can choose whether to add error bars on the graph and which statistical value to show as error bars. |
| First Factor | This option only shows with two way ANOVA and two way RM ANOVA report with interactions. With two factors have been selected as Input, you can choose how to construct the pairwise comparisons:Outer compares items across the first factor, while Inner compares items within the first factor. |
| Significance Mark | Specify how to indicate statistical significance on the plot:
|
| Level for P-value | For Asterisk with Bracket chosen, you can choose the levels(threshold values) for P-values. |
| Hide If P-value Greater Than | Hide the significance mark of bars if P-values greater than a threshold value. |
| Label font size | Specify the font size of significance labels. |
| Bracket Type | Choose the barcket type of significance marks.
|
| Line Thickness | Specify the line thickness for brackets. |
| Allow Brackets Outside Plot Area | Specify whether to show the brackets outside the graph layer frame. |
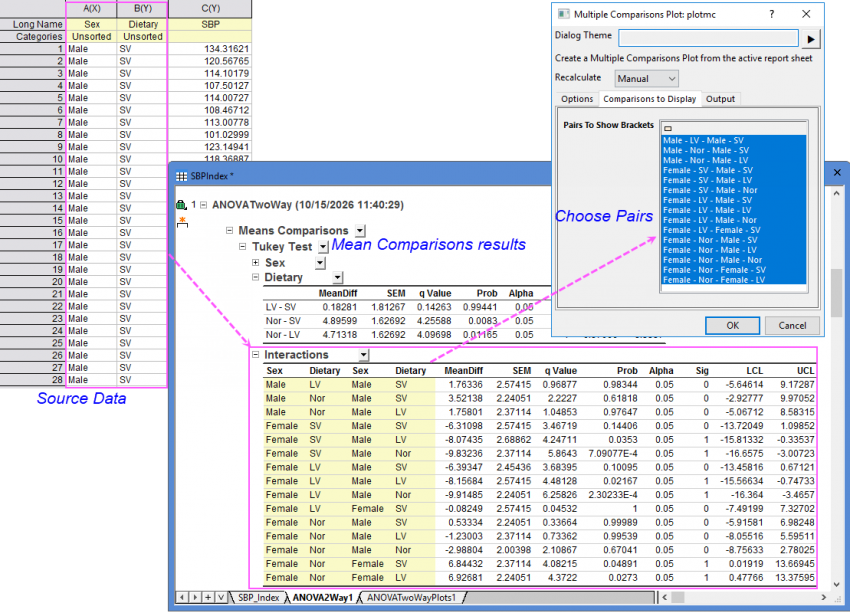
Comparisons to Display tab
Choose the comparison interactions to show the brackets.
Output tab
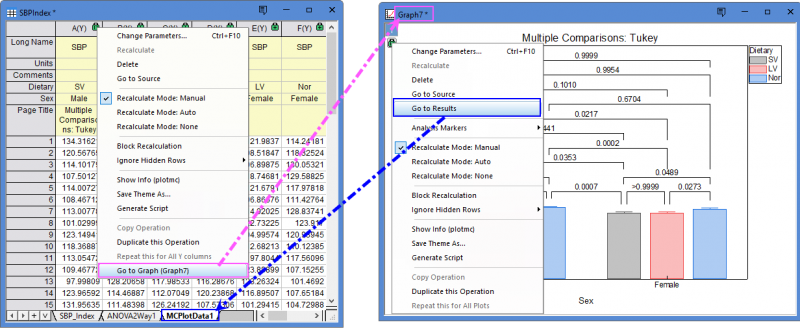
Choose the worksheet to output plot data. By default, a new sheet in current book will be created and used to store the plot data.
You can click the green icon and choose the corresponding menu item to switch between the plot data worksheet and the results graph window.
Supported in these Statistical Tools
- Tests for two samples
- Tests for multiple samples
- One-Way ANOVA(if any test in Means Comparison tab is selected)
- One-way Repeated Measures ANOVA(if any test in Means Comparison tab is selected)
- Kruskal-Wallis ANOVA(if Dunn't Test is selected)
- Moods Median Test(if Dunn't Test is selected)
- Friedman ANOVA(if Dunn't Test or Wilcoxon-Nemenyi-McDonald-Thompson Test is selected)
- Two-Way ANOVA(if any test in Means Comparison tab and Interaction in Input tab are selected)
- Two-way Repeated Measures ANOVA(if any test in Means Comparison tab and Interaction in Input tab are selected)
Creating Significant Plot
For One-Sample T-Test and One-Sample Wilcoxon Signed Rank Test, clicking the Create Significant Plot icon will open the Significant Plot dialog to create a Significant plot which is a variant of multiple comparison plot.
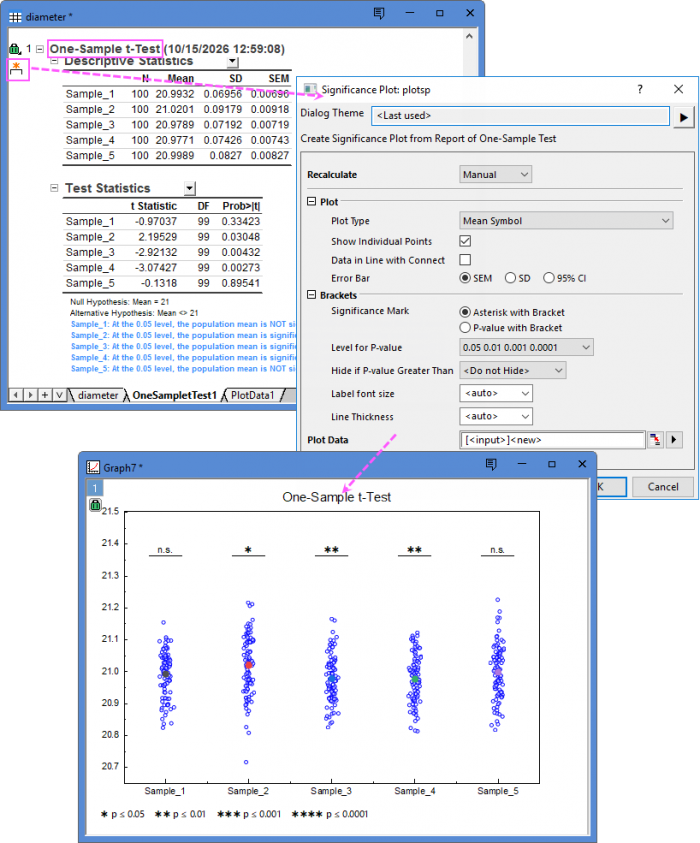
All these controls in this dialog are same as those in the Options tab of Multiple Comparisons Plot dialog.