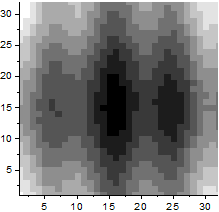
29.18.3 Gray Scale Map Contour
Contour-GrayScaleMap
Data Requirements
- Select at least one Z column (or a range from at least one Z column). If the Z column has associated XY columns, then the XY columns are used; otherwise, the worksheet's default XY values are used.
- or
or
- Matrix: A matrix sheet. Multi-object sheet is supported.
or
- Image: An Image window. Multi-frame image is supported. Refer to this page below to see how to flip through all frames.
Creating the Graph
Activate the matrixsheet/image window, or select required data from worksheet.
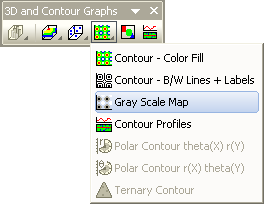
From the menu, choose .
or
Click the Gray Scale Map button on the 3D and Contour Graphs toolbar.
Template
Worksheet
Matrix/Image
(All installed to the Origin program folder).
Notes
Contour plots from worksheet supports user-defined boundaries. To set contour plot boundaries, open the Plot Details dialog and go to the Contouring Info tab.