
Matrix: A matrix of Z values.
Worksheet: XYZ columns.
Select required data.
Select .
ContQuiver.otpu
CONTQUIVERXYZ.optu
(Installed to the Origin program folder.)
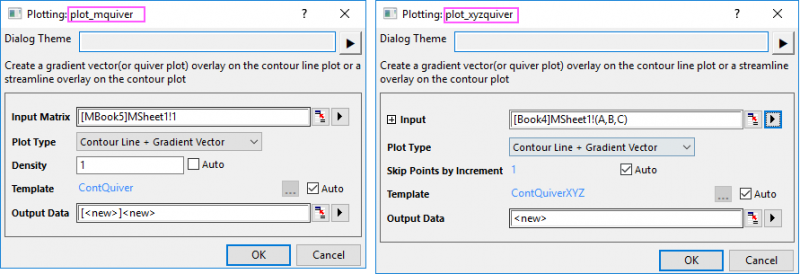
Contour Line + Gradient Vector graph is a graph with gradient vector(or quiver plot) overlaying on the contour line plot.
The X-Function plot_mquiver or plot_xyzquiver is used to create such graph:
When Plot Type is Contour Line + Gradient Vector, the output is a worksheet with XYAM columns for gradient vector. Firstly, the X-Function plot_mquiver will use the gradient function to get gradient matrix in both directions(U and V), and then transfer U and V to XYAM columns and output them to a worksheet. It will plot a contour from source matrix and plot a XYAM vector plot based on result sheet. Density option can be used to specify the desired density of the vector lines.
When Plot Type is Contour + Streamline, the output is two matrix objects. Firstly, the X-Function plot_mquiver will use the gradient function to get negative gradient matrix in both directions(U and V), and then output U and V as two matrix objects. It will plot a contour from source matrix and plot a streamline plot based on U and V.
For XYZ data, the control Skip Points by Increment will show up instead of Density option for "Contour+Vector". It keeps one point and skips N-1 points(N is the setting). When total number of points exceed 900(30*30), N will be set to ceil(number of points/900,1) automatically. Then use the reduced xy points to get the vector data. When total number is less than 900, set N=1 which means no skip, use original XY point to get vector for original data points.
For Streamline, this tool provides control Number of Points in X Direction, Number of Points in Y Direction. By default, they will be set to Count(unique(x/y)). Then get matrix by min_x, max_x, np_x, min_y, max_y, np_y and use this matrix to get matrix result for streamline.
| Minimum Version: Origin 2024b | Last Update: Origin 2025 |