31.2.3 Column Scatter

Data Requirements
Select one or more columns or a range of data from at least one column.
Creating the Graph
Select the data and:
- From Origin menu, select Plot > Basic 2D: Column Scatter
OR
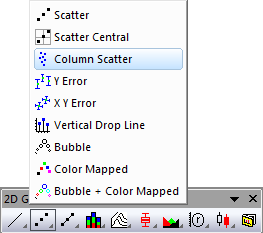
- Click the Column Scatter button in the 2D Graphs toolbar:
Template
ColumnScatter.otp (installed to the Origin program folder).
Notes
In fact, the column scatter plot is a box chart whose box type is set to Data, and jitter points has been selected in the Data tab.
In order to create grouped column scatter plot, you can create a grouped box chart with indexed data or raw data first and select Box_Column Scatter from Graph Theme drop-down list.