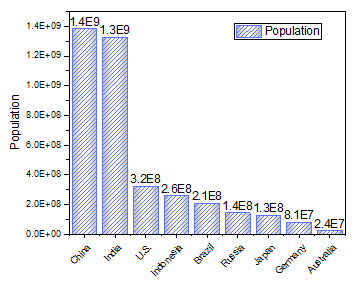
31.4.2 Column + Label Graph
Data Requirements
Select one or more Y columns or a range of data from at least one Y column. If there is an associated X column, X column supplies X values; otherwise, sampling interval of the Y column or row number is used.
Creating the Graph
Select required data.
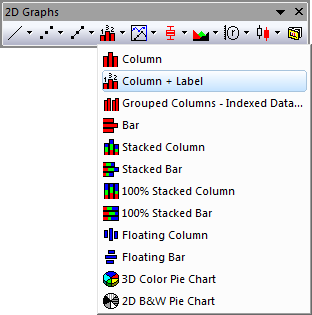
From the menu, select .
or
Click the Column + Label button on the 2D Graphs toolbar.
Template
ColumnLabel.OTP (installed to the Origin program folder).
Notes
The Y value of each data point is represented as the label of that column. Go to the Label tab of Plot Details dialog to customize the label , including the source used as label, format, position, etc.