31.1.6 Colormapped Line Series
Data Requirements
Select at least one Y column (or a range from at least one Y column). Ideally, select at least two Y columns (or a range of at least two Y columns).
If there is an associated X column, X column supplies X values; otherwise, sampling interval of the Y column or row number is used.
Creating the Graph
Select required data.
From the menu, choose .
Template
LineCmap.otpu (installed to the Origin program folder).
Notes
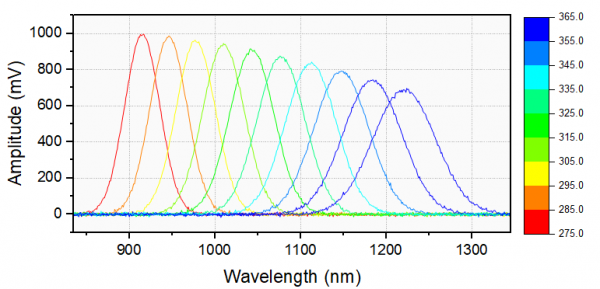
This graph is a 2D line plot with multiple curves, and all of the curves are colored by a specified colormap. By default, Plot Index has been used to colormap the curve colors, you can go to the Line tab of Plot Details dialog and use the Color Control to select other column label row to colormap the curves.
Note:
|