31.18.1 Color Fill Contour
Data Requirements
- Worksheet:
- Select at least one Z column (or a range from at least one Z column). If the Z column has associated XY columns, then the XY columns are used; otherwise, the worksheet's default XY values are used.
- or
- A block of worksheet cells(virtual matrix)
or
- Matrix: A matrix sheet. Multi-object sheet is supported.
or
- Image: An Image window. Multi-frame image is supported. Refer to this page below to see how to flip through all frames.
Creating the Graph
Activate the required data.
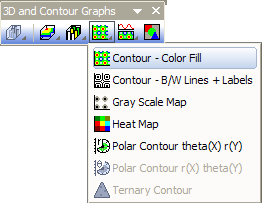
From the menu, choose .
or
Click the Contour - Color Fill button on the 3D and Contour Graphs toolbar.
Please see more details on creating and customizing Color Fill Contour in the 3D and Contour Graphing chapter.
Template
Worksheet
- TRICONTOUR.OTP
Matrix/Image
- CONTOUR.OTP
(All installed to the Origin program folder).
Notes
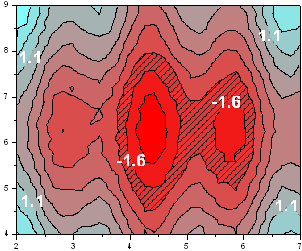
- Ranges of Z values are denoted on an XY grid using contour lines and fill colors from a color map.
- Contour plots from worksheet supports user-defined boundaries. To set contour plot boundaries, open the Plot Details dialog and go to the Contouring Info tab.
- You can extract contour line data by right-clicking on selected contour lines and choosing Extract Contour Lines. See this topic for details.
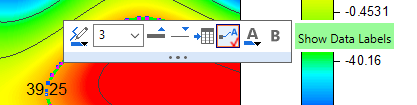
- Click twice (do not double-click) on a contour line and popup a Mini Toolbar for single-level customization.
- When the contour plot is created from a matrix, layer size is a function of the ratio between Xmax - Xmin and Ymax - Ymin and the layer's Link Axis Length to Scale with X:Y Ratio option is set to 1, by default.