29.16.5 Color Map Surface with Projection
Color-Map-Surface-Projection

Data Requirements
- Worksheet: Select one Z column (or a range from one Z column). If the Z column has associated XY columns, then the XY columns are used; otherwise, the worksheet's default XY values are used.
or
- Matrix: A matrix of Z values.
or
- Image: the active page of an Image window
Creating the Graph
Activate the matrixsheet/image window, or select required data in the worksheet.
From the menu, choose .
or
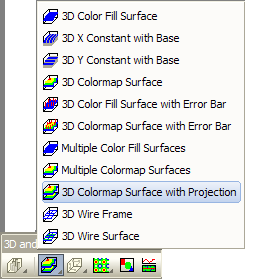
Click the 3D Colormap Surface with projection button on the 3D and Contour Graphs toolbar.
Template
glCMAP.OTP (installed to the Origin program folder).