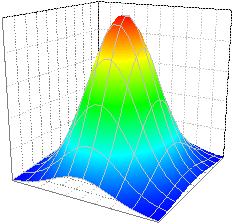
29.16.4 Color Map Surface
Color-Map-Surface
Data Requirements
- Worksheet: Select at least one Z column (or a range from at least one Z column). If the Z column has associated XY columns, then the XY columns are used; otherwise, the worksheet's default XY values are used.
- If you have XYZZ data, want to plot a 3D surface and set the second Z as colormap, you can specify the mapping column on Fill tab of the Plot Details dialog.
or
- Matrix: A matrix of Z values.
- If you have two matrices and want to color map a surface plot using a second matrix, these two matrices should be in same matrixsheet as matrix objects.
or
- Image: the active page of an Image window
Creating the Graph
Activate the matrixsheet/image window or select required data from worksheet.
From the menu, choose .
or
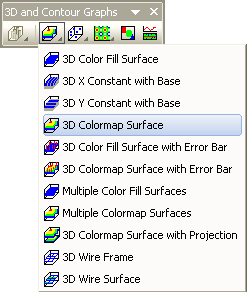
Click the Color Map Surface button on the 3D and Contour Graphs toolbar.
Template
- glCMAP.OTP (OpenGL)
- Cmap.OTP
(Installed to the Origin program folder).
Notes
The Z values determine a surface of X and Y grid lines and fill color from a color map.