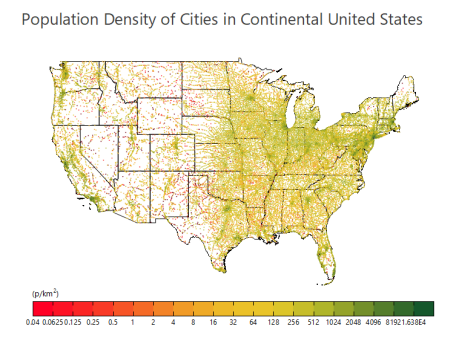
29.2.13 Color Dots
Color-Dots
Data Requirements
Select exactly two Y columns or a range of data from two Y columns. If there is an associated X column, X column supplies X values; otherwise, sampling interval of the Y column or row number is used.
Creating the Graph
- Select data from two Y columns.
- From the menu, select .
Template
ColorDots.OTPU (installed to the Origin program folder).
Notes
Use this template for plotting large numbers of scatter points, where you have a pre-calculated column of some intensity factor that you then use to color each scatter point. This template differs from the Density Dots template in that Density Dots calculates the intensity factor from the number of overlaid points.
- Speed Mode is turned off, by default, so that all data points are represented.
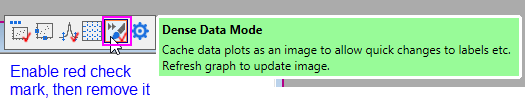
- For faster graph redraws, bitmap caching is turned on for this graph type. When caching is used, a prepared bitmap is resized and re-proportioned, as needed, when the window is resized or stretched. In some cases, this bitmap may become pixelated or distorted and if this is unacceptable, you can turn caching off by clicking the Dense Data Mode button on the page-level Mini Toolbar, twice (after the second click, there should not be a check-mark on the button).
 .
.