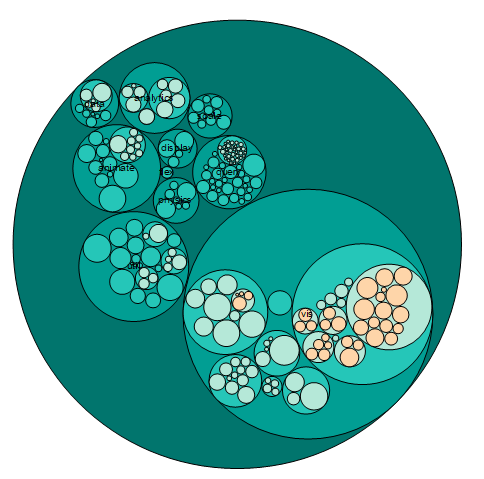
Circular packing graph can used to visualize a hierarchic organization, We can consider it as a variant of a treemap or a dendrogram, where each node of the tree is represented as a circle and its sub-nodes are represented as circles inside of it. The size of the circles is proportional to a specific value column.
Origin supports two kinds of data type to present the hierarchic organization:
Note: All column designations will not be considered in either of these two modes.
Select required data.
From the menu, choose to open the X-Function plotcpack dialog.
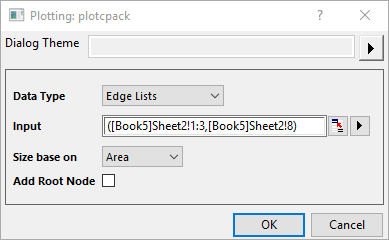
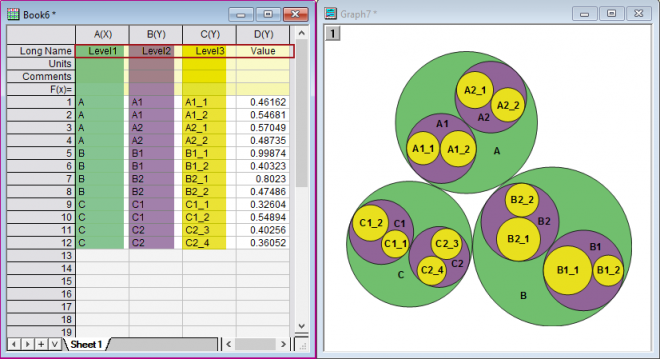
You can select one of the two data types, Edge Lists and Multiple Levels. For the data structure for these two data type, please check the illustration below:
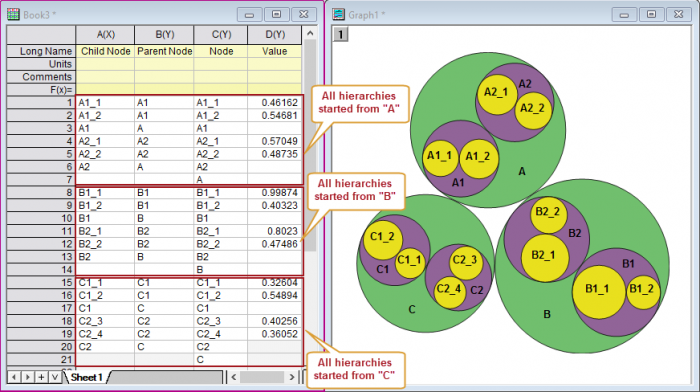
Note: Here, Origin doesn't support multi-level node labels( connected with dots, such as AA.BBB.xx), but treats it as general string labels.
Select the corresponding columns to plot the hierarchies and circles. Here, the column designation won't be considered.
Specify how to apply the value for each leaf, as the circle area or radius.
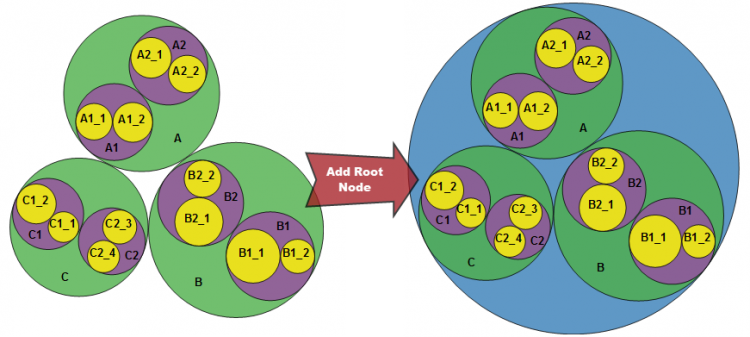
Specify whether add the root node to encircle all circles.
cpack.OTPU (installed to the Origin program folder).
Circular Packing graph can be customized with