29.9.31 Chord Diagram/Chord Diagram with Ratio Layout
Chord-Diagram
|
|
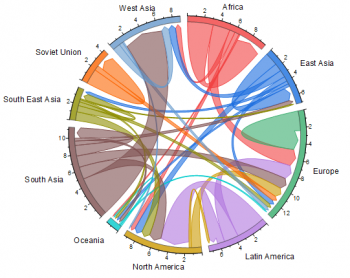
| Chord Diagram
|
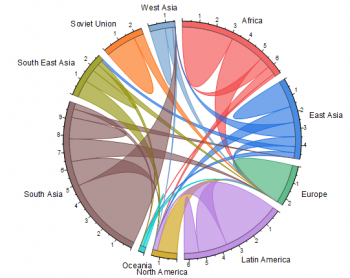
Chord Diagram with Ratio Layout
|
Data Requirements
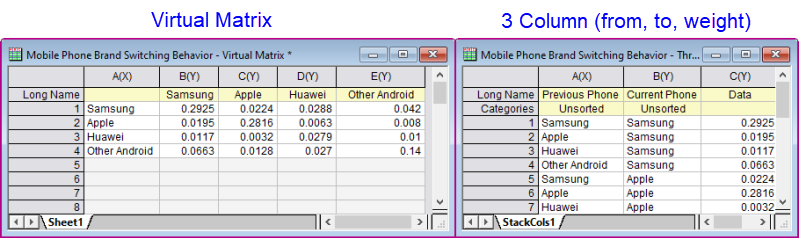
Data can be arranged in two forms:
- a virtual matrix, where input and output nodes are in rows and columns.
- a worksheet with 3 columns where the first two columns are categorical and list the "From" and "To" nodes, while the third column is numeric and contains the "Weight" measurement.
Creating the Graph
- Select required data.
- From the menu, select .
The plot_chord Dialog
If you selected a block of values, the first two columns of which are not text or categorical, or you didn't select any data, a X-Function dialog will pop up:
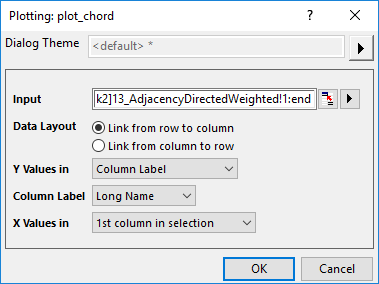
Input
Specify the input block, just like the block of a virtual matrix.
Data Layout
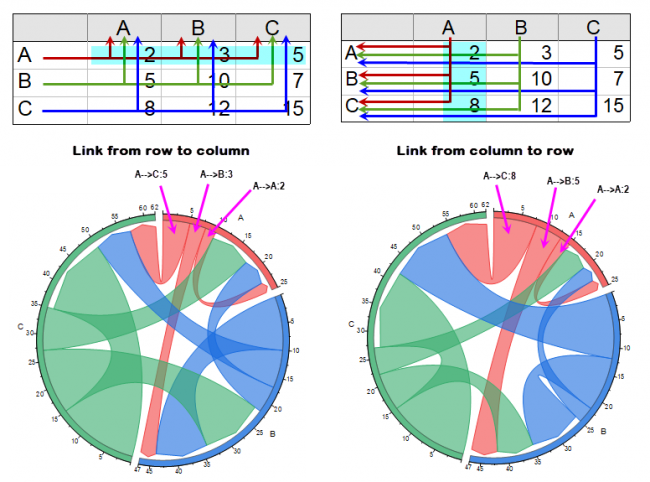
Specify the flow direction of the links.
- Link from row to column: The link starts from the specified value in rows, and the link ends at the specified value in columns.
- Link from column to row: The link starts from the specified value in columns, and the link ends at the specified value in rows.
X Values in/Y Values in
Specify the X values and Y Values in the selected block, according to the data layout settings.
In general, the flow starts from X values and ends at the Y values. That means, X values are the link starts and Y values are link ends.
Column
When you selected Column Label for X Values in/Y Values in drop-down list, you can further specify which column label row stores the X or Y values*(link starts or link ends).
X Range/Y Range
When you selected Custom for X Values in/Y Values in drop-down list, you can further specify a range which stores the X or Y values*(link starts or link ends).
Template
chord.otpu (installed to the EXE folder of Origin)
ChordRatio.otpu (installed to the EXE folder of Origin)
Notes
- The difference in settings between Chord Diagram and Chord Diagram with Ratio Layout is whether you have checked the Ratio Layout in Layout tab of Plot Details dialog.
- Once you have checked the Ratio Layout, the exchange between two nodes will be shown within one link; if the Ratio Layout hasn't been checked, the exchange will be shown in two links, flowing from A to B and flowing from B to A.
- When Ratio Layout is checked, you can choose between Pre Mode and Post Mode.
For information on the customizing a Chord diagram, see these topics: