
Select at least one column to create Empirical CDF plot and/or Theoretical CDF plot.
Select multiple data and group column to compare cumulative distribution of different data/groups.
Select required data.
From the menu, select Plot > Statistical: CDF Plot to open the plot_cdf dialog.
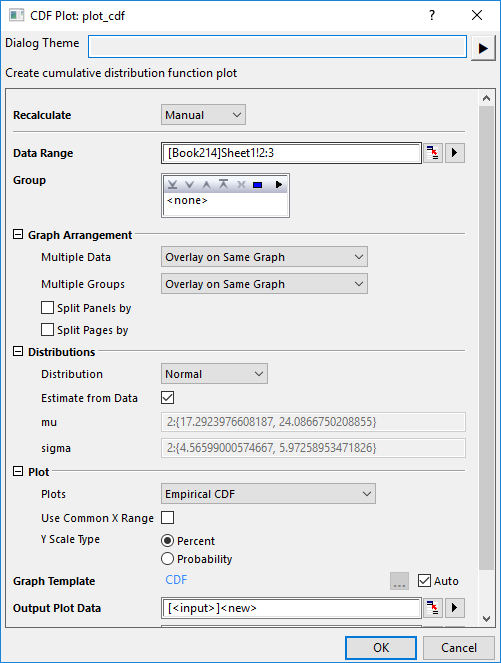
| Data Range | Select input data column(s). |
|---|---|
| Group | Select grouping column(s). |
| Graph Arrangement | Choose how to arrange the plots.
|
| Distribution |
|
| Plot |
|
| Output Plot Data | Specify which sheet the plot data is output to. |
| Output Graphs | Specify which sheet the result graphs is output to. |
CDF.OTPU(installed to the Origin program folder).
CDF plot, fully-named as cumulative distribution function plot, is used to examine the distribution of a sample data. It shows the empirical and/or theoretical cumulative distribution function of the data. You are allowed to decide how to arrange multiple source data and their groups. And the distribution information values(mu, sigma and N) for each groups of each data will be output to the result graph(s) automatically.
| Minimum Version: Origin 2025b | Last Update: Origin 2026 |