31.9.42 Cause-and-Effect Diagram

Contents
Data Requirements
Select at least two text columns to create a Cause-and-Effect Diagram (also known as a Fishbone or Ishikawa Diagram).
Creating the Graph
Select required data.
From the menu, select Plot > Statistical: Cause-and-Effect Diagram to open the plot_causeeffect dialog
The plot_causeeffect Dialog Box
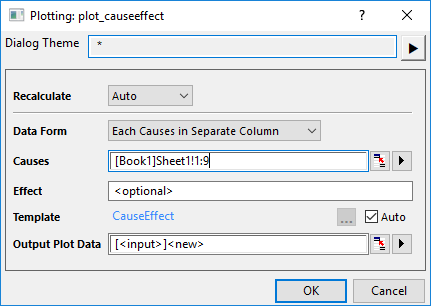
| Data Form | There are two data structures supoorted for this graph:
|
|---|---|
| Parent | Select a column as Parent causes when Data Form is set to Parent Child Columns. |
| Child | Select a column as Child causes when Data Form is set to Parent Child Columns. |
| Causes | Select all causes columns as Causes when Data Form is set to Each Causes in Separate Column. |
| Effect | Enter the label for the effect or problem that you are trying to solve optionally. |
| Template | By default, the built-in template "CauseEffect" has been selected. You can uncheck Auto box to choose a user-defined template. |
| Output Plot Data | Specify where to output the plot data. The plot data is arranged as Parent-Child columns. |
Template
CauseEffect.OTPU(installed to the Origin program folder).
Notes
A Cause-and-Effect diagram is a visual tool that helps identify and organize potential causes of an issue or effect. It is also known as a fishbone diagram or Ishikawa diagram. Pepole uses it widely in many industries to identify the root causes of issues.
The diagram resembles a fish skeleton: The "head" is the specific problem or effect you want to solve; The "spine" is a central horizontal line pointing to the problem; The "ribs" are major categories of potential causes that branch off the spine; The smaller bones are the specific causes and sub-causes branching off the category ribs.
The categories can vary based on the context and nature of the problem. For example:
- In manufacturing, the categories may include people, machines, materials, methods, and the environment.
- In healthcare, the categories may include patients, processes, equipment, environment, and staff.
To customize the diagram, you can go to the below tabs in Plot Details dialog.
Version Information
| Minimum Version: Origin 2026 |