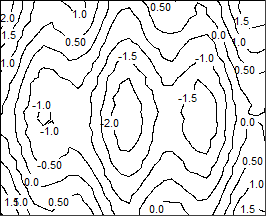
31.18.2 Black and White Lines with Labels Contour
Data Requirements
- Worksheet:
- Select at least one Z column (or a range from at least one Z column). If the Z column has associated XY columns, then the XY columns are used; otherwise, the worksheet's default XY values are used.
- or
- A block of worksheet cells (virtual matrix)
or
- Matrix: A matrix of Z values.
Creating the Graph
Activate the matrixsheet or select required data from worksheet.
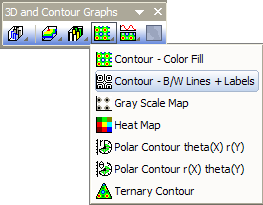
From the menu, choose .
or
Click the Contour - B/W Lines + Labels button on the 3D and Contour Graphs toolbar.
Template
Worksheet
- TriContline.OTP
Matrix
- CONTLINE.OTP
(Installed to the Origin program folder).
Notes
Contour plots from worksheet supports user-defined boundaries. To set contour plot boundaries, open the Plot Details dialog and go to the Contouring Info tab.