or
Activate the matrixsheet or select required data from worksheet.
From the menu, choose .
or
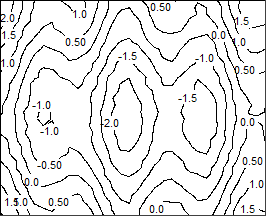
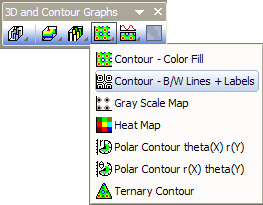
Click the Contour - B/W Lines + Labels button on the 3D and Contour Graphs toolbar.
Worksheet
Matrix
(Installed to the Origin program folder).
Contour plots from worksheet supports user-defined boundaries. To set contour plot boundaries, open the Plot Details dialog and go to the Contouring Info tab.