29.13.2 Bullet Chart
Bullet-Chart
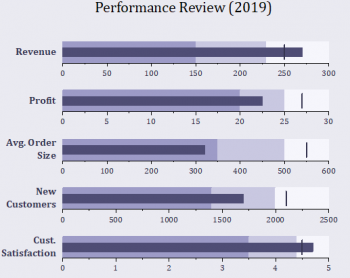
| Bullet Chart
|
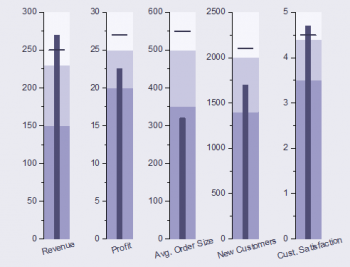
Vertical Bullet Chart
|
|
|
| Normalized Bullet Chart
|
|
|
|
Data Requirements
Select at least 3 Y columns: 1st Y represents actual value, 2nd Y represents target value, the rest Ys represent qualitative ranges of performance.
Creating the Graph
Select required data.
Select
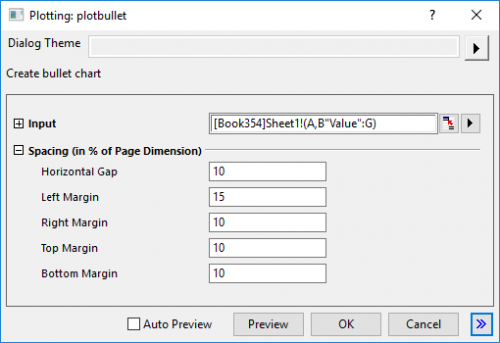
When you selected the required data and chose the menu above, a dialog "Plotting: plotbullet" will be opened to allow you adjust the spacing between and around the layers.
Template
Bullet.otpu ; BulletVerti.otpu ; BulletNormal.otpu (installed in the Origin program folder)
Notes
- Input could be XYY(YY...). First Y column should be current value, plotted as a thin bar; Second Y column should be plotted as a scatter plot, the symbol shape of which is vertical bar; Third and more Y columns are optional, plotted as incremental stack bar.
- Plot Type order: Incremental Stack Bar --> Thin bar --> Scatter
- Each row should be plotted as one layer, and each layer should be stacked as one column.
- Vertical Bullet Chart plots bars as columns, and uses horizontal bar shape for symbol. Each layer should be stacked as one row.