|
|
|
|
|
|
|
|
|
|
|
|
Select one or more Y columns (or a range of one or more Y columns). If there is an associated X column, X column supplies X values; otherwise, sampling interval of the Y column or row number is used.
Users who need to condition their data may find the LabTalk diff() function to be useful.
Select desired data.
Select
(installed to the Origin program folder).
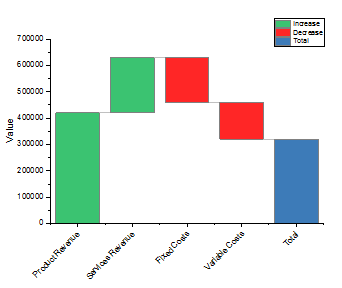
BridgeChart.otpu
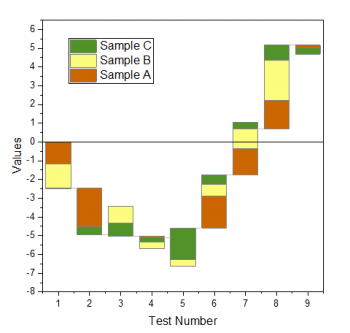
StackedBridgeChart.otpu
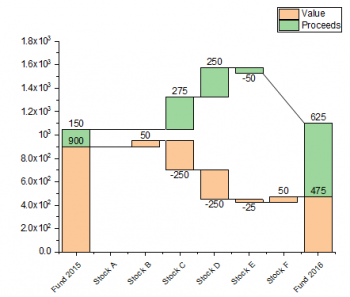
StackedTBridgeChart.otpu
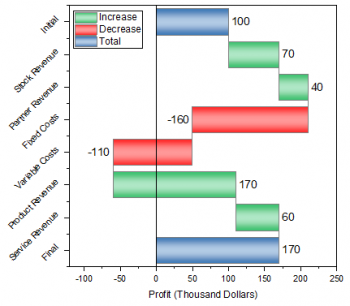
HorizBridgeChart.otpu
In the Plot Details dialog, there is a separate tab Bridge Chart which is used to control the bridge chart elements.
Additionally, in Origin Central (F11 or Help: Origin Central), you can find several graph samples showing how Origin supports Bridge Charts.