31.9.5 Box Chart Graph
| |
|
 |
 |
| |
|
 |
 |
Data Requirements
You need to have one or more worksheet columns to create such graph.
Creating the Graph
Box Chart
- Select required data.
- From the menu, select .
- or
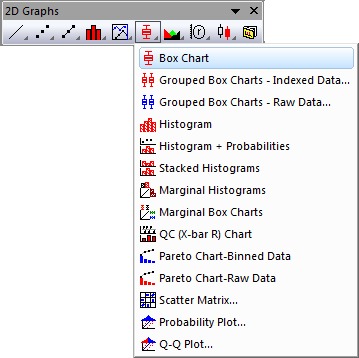
- Click the Box Chart button on the 2D Graphs toolbar.
Box Chart with Data Points Overlap
- Select required data.
- From the menu, select .
Box Chart with Normal Distribution Curve
- Select required data.
- From the menu, select .
Half Box with Data Points
- Select required data.
- From the menu, select .
Please see more details on creating and customizing box charts in the Creating Box Charts page.
Template
Box Chart BOX.OTP
Box Overlap: BOX+DATA+OVERLAP.OTP
Box Normal: BOX+DATA+NORMAL.OTP
Half Box: HalfBox.OTP
Three templates above are installed to the Origin program folder.
Notes
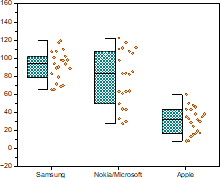
- Each Y column of data is represented as a separate box. The column names or labels supply the X axis tick labels. By default, the box is determined by the 25th and 75th percentiles. The whiskers are determined by the 5th and 95th percentiles.
- If you have multiple boxes, you can go to the Group tab to enable Subgrouping. You can also create a grouped box chart directly from either indexed data or raw data.
- Many variations are supported, such as Interval plot and Scatter Interval, Bar chart, Box chart or Bar chart with Normal distribution curve, Box chart or Bar chart with data points overlapped.
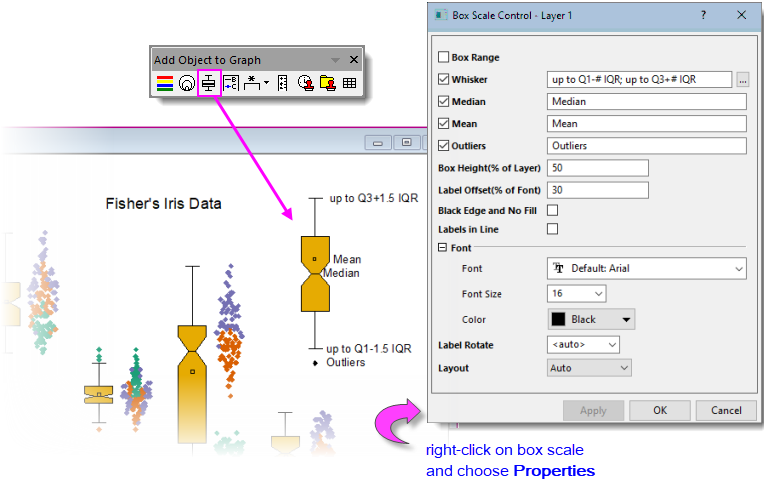
- You can add a Box Scale to your box charts. The Box Scale diagrams key user-selected box statistics.