31.2.14 Binned Scatter
Contents
Data Requirements
Select at least one Y column. If there is an associated X column(s), X column(s) supplies X values; otherwise, sampling interval of the Y column(s) or row number is used.
Creating the Graph
- Select the source XY column(s).
- From the menu, select .
The plot_binnedscatter dialog will be opened.
The plot_binnedscatter Dialog
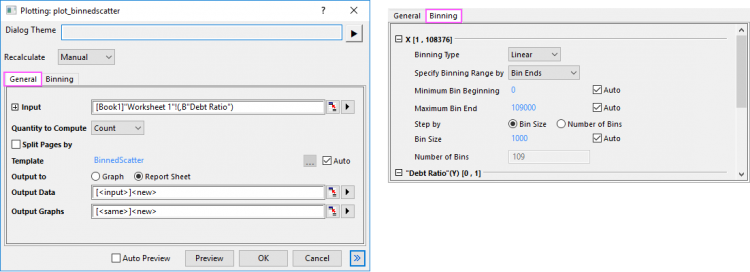
One Y column selected:
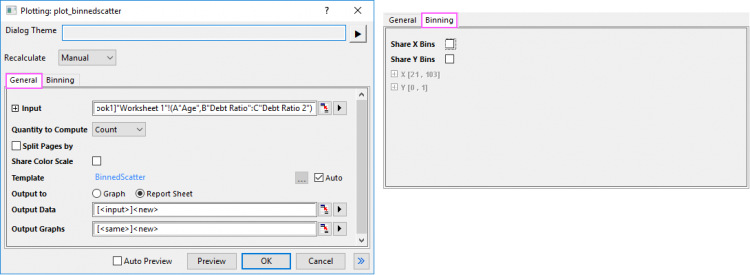
Multiple Y columns selected:
General Tab
Quantity to Compute
Currently, Origin supports to compute the count number and mean values for the XY binning ranges. If you choose Count, the frequency count will be calculated; if choosing Mean, you have to select another column to calculate the mean values within each binning grid cells.
Column to Compute Mean
Choose a column to calculate the mean values when Quantity to Compute has been set to Mean.
Split Pages by
Check this box to select grouping column(s) to split the data into different graph pages.
Share Color Scale
This control is only availiable for multiple columns selected as Input. Check this box to share the same color scale within the different input columns.
Binning Tab
When one Y column selected as Input, you can set the X and Y binning options seperately; When multiple XY columns selected, you need firstly decide whether share X/Y bins for different XY ranges.
Share X/Y Bins
For multiple XY input ranges, you need decide whether share the X/Y bins between the different X/Y columns. Once Share X Bins or Share Y Bins checked, you can set the binning for X and Y columns.
Binning Type
Here, Origin supports two types of binning: Linear or Log10.
Specify Binning Range by
Specify the way to define the X/Y binning range.
- Bin Centers
- X/Y binning range is indicated by bin centers.
- Bin Ends
- X/Y binning range is indicated by bin ends.
Minimum Bin Beginning
Specify the minimum X/Y bin starting value.
Maximum Bin End
Specify the maximum X/Y bin ending value.
Step by
Specify bin construction, including Bin Size and Number of Bins.
Bin Size
Specify the fixed step size for X/Y bins.
Number of Bins
Generated automatically by the bin range and increment.
Template
BinnedScatter.OTPU (installed to the Origin program folder).
Notes
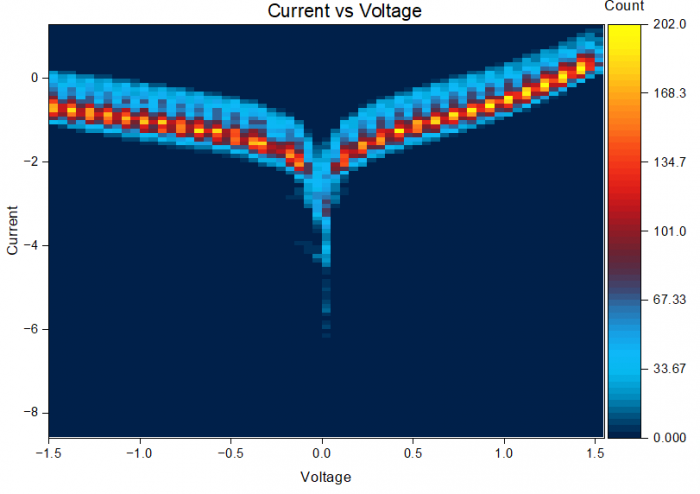
Binned Scatter graph is a variant of Heatmap. It use the same binning method as 2D Frequency Count tool.
If the input data are splitted into pages, the result worksheet will contain multiple virtual matrices; each two matrices are separated by one empty column, and the user-defined parameter row(s) are added to identify the different groups.