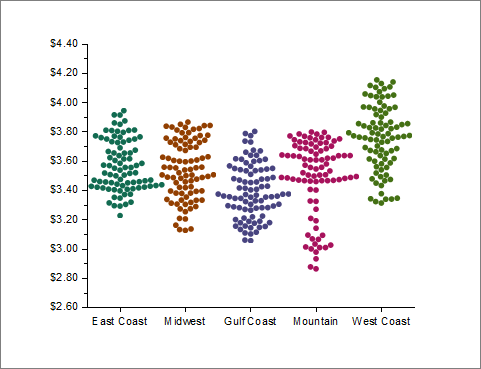
31.9.3 Beeswarm Plot
Data Requirements
Select one or more worksheet columns.
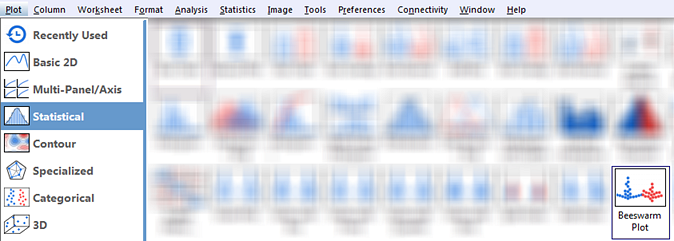
Creating the Graph
- Select required data.
- From the menu, select .
Template
Beeswarm.OTPU (installed to the Origin program folder)
Notes
- Each Y column of data is represented as a separate swarm of data points. Column Long Names, if they exist, supply the X axis tick labels, otherwise Short Names are used.
- The Beeswarm Plot is a box plot variant with Box Type = Data and Data Type = Dots with Arrange Points = Swarm.