29.11.1 Bar Map
Bar-Map
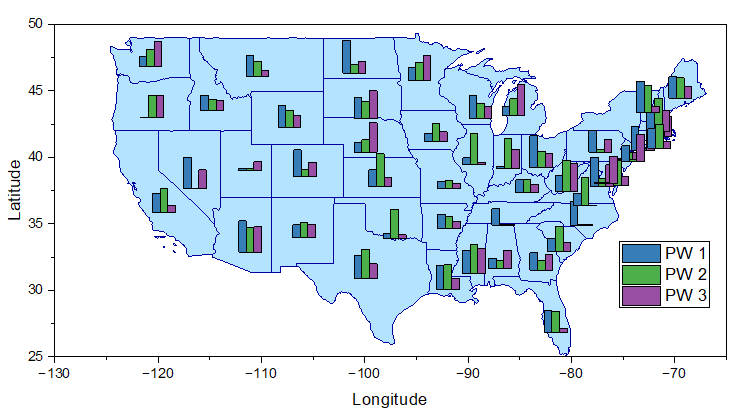
Data Requirements
Select X with at least 3 Y columns to create bar map. The first two columns(X and Y) decide the location of each bar chart. Other Y columns are used to plot the bar charts by rows. That means all Y values from the second Y column in each row will be plotted a bar chart and these bar charts will be located in the first XY column.
Creating the Graph
Select required data.
From the menu, choose .
Template
BarMap.OTPU (installed to the Origin program folder).
Notes
Bar Map chart is a set of Bar charts, using a X-Y data to locate the bar charts. Each bar chart is created by one row of the Y columns.
- To change the bar size, you can go to the Map tab of Plot Details dialog.
- To plot a Stacked Bar Map, you can go to the Map tab of Plot Details dialog to check the Stack check box; Furthermore, you can check the Normalize to Percent check box to normalize the stacked bar to the specified Maximum Height.
- To control the spacing between the bars in each bar chart, you can go to the Spacing tab of Plot Details dialog.
- To switch the plot type between Bar Map and Pie Map,
- Click on one bar/pie chart and then click Change Plot to button
 on the mini toolbar to select Pie Chart or Bar Chart .
- Double-click on bar/pie chart to open Plot Details dialog; with the bar/pie plot selected, select Pie Chart or Bar Chart under the Plot Type drop-down list.