29.4.3 Bar Graph
Bar-Graph
Data Requirements
Select one or more Y columns or a range of data from at least one Y column. If there is an associated X column, X column supplies X values; otherwise, sampling interval of the Y column or row number is used.
Creating the Graph
Select required data.
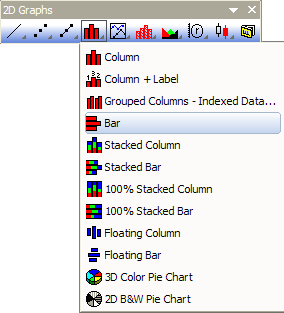
From the menu, select .
or
Click the Bar button on the 2D Graphs toolbar.
Template
BAR.OTP (installed to the Origin program folder).
Notes
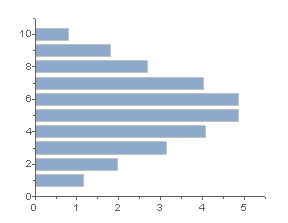
- The Y value of each data point in the data plot is represented as the height of a column. Each column has a fixed width, and each "X group" of columns is centered at the associated X value.
- To establish Y=1 as the "floor", or Y value which alters the direction of column graphs displayed on a logarithmic scale, select the Log Scale use 1 as Floor check box on the Graph tab in the Options dialog box ().
- In some cases, disabling Clip Data to Frame still results in clipping of data in column/bar graphs. If this occurs, Clip Data can be defeated by typing the following line of script into the Script Window and pressing ENTER:
@CLP = 1
- When the X column of a column/bar graph contains text, this text is used to label major ticks, ordered by row index. Prior to Origin 2018, when applying a worksheet data filter, plots registered the vacant ticks and labels of filtered data, though the data points were not plotted. This was changed in Origin 2018 so that ticks associated with filtered data no longer display (This only applies to X columns that contain text and are NOT Set as Categorical).
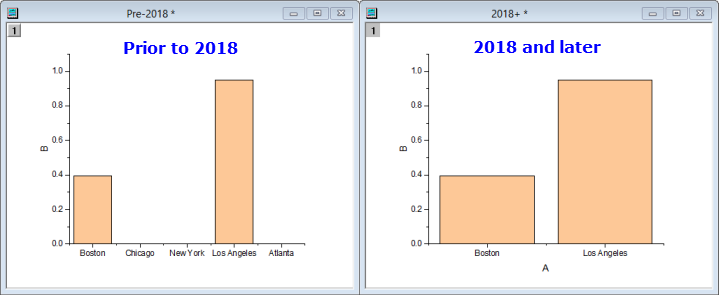
You can restore the pre-2018 behavior using wks.KHRA=1; (you could, for instance, add this to the workbook Script Panel).