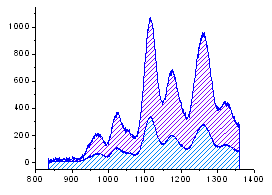
31.12.1 Area Graph
Data Requirements
Select at least one Y column of values (or a range from at least one column). If there is an associated X column, X column supplies X values; otherwise, sampling interval of the Y column or row number is used.
Creating the Graph
Select required data.
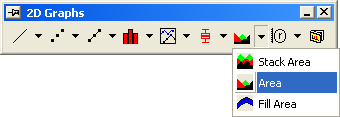
Select .
or
Click the Area button on the 2D Graphs toolbar.
Template
AREA.OTP (installed in the Origin program folder).
Notes
The area between the data plot and the "From" Y axis value is filled for each data plot by default. When more than one data plots are plotted together in a layer, one might block each other. To plot an area graph stacked on the previous area graph (using the upper bounds of the previous area graph as the baseline of the next area graph), select .