29.9.29 Alluvial Diagrams
Alluvial-Diagram
Data Requirements
Select at least two columns of values or a range of values from at least two columns. Plot designation does not matter; selected columns will be treated as Y columns.
Creating the Graph
- Select required data.
- Select Plot > Categorical: Alluvial.
For information on the customizing allivial diagrams, see these topics:
Template
Alluvial.otpu (installed to the EXE folder of Origin)
Notes
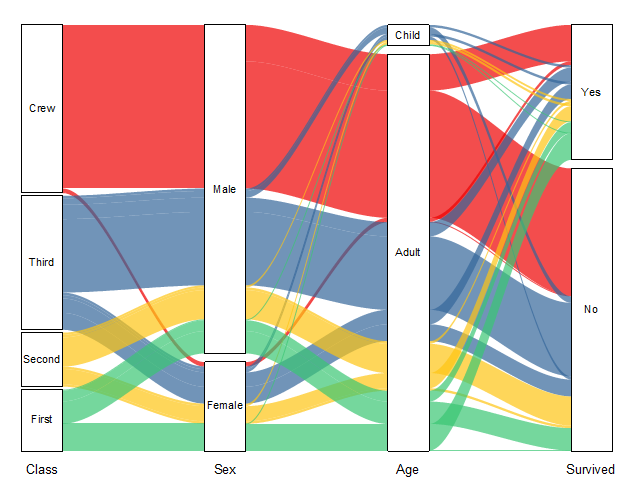
To describe the details about this kind of graph well, let's call the little black rectangles "nodes", the colored areas (linking nodes) "links", and the vertical groups of nodes "steps".
Alluvial diagrams represent weighted flows among nodes. Alluvial diagram supports two kinds of data arrangement:
- Raw data in worksheet: Individual observations are stored as rows, while the variables, or characteristics are stored as column. Each row of the dataset becomes a series of linking flows, each column defines a step, the cells with same value defines a node.
- Summarized data: Worksheet with multiple label columns and a value column - each label column is shown as individual column of nodes on graph and the last column should be the column of link values.
In a alluvial diagram Origin created, you don’t need define directly the height of the nodes:(1)For Raw data input, the height of nodes and the width of flows is therefore linked to the number of lines in the dataset containing the same couple of nodes. Flows coming from and going to the same couple of nodes are grouped. (2)For summarized data input, the values in last column will weight the link width and node height within a whole flow. Flows coming from and going to the same couple of nodes are grouped too.
Further Customization:
- You are allowed to adjust the gap between nodes and the gap between the node and flow link for all plots together.
- Click on any node, the whole flows input or output this node will be highlighted including the links and the involved nodes.
- Click on any link set, the whole flows from the start to the end will be highlighted including the links and the the involved nodes.
- You are allowed to set the link color, to follow the nodes or use the color chooser.
- The link lines can be classified and combined in four methods.
- You can decide whether and how to show labels for nodes and/or links.