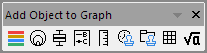
30.1.5 The Add Object to Graph Toolbar

|
Creates a color scale for 3D contour plots and color mapped surfaces. |

|
Create a bubble scale for the plot. |

|
Create a box scale for the box plot. |

|
Generates a new graph legend. Primarily useful after adding data plots to a single layered graph. |

|
Adds a moveable, sizable scale object to the active graph. |

|
Stamp the active window with the date and time. |

|
Stamp the active window with project name and path. |

|
Adds a linked table to your graph window. |

|
Insert LaTeX equation. |