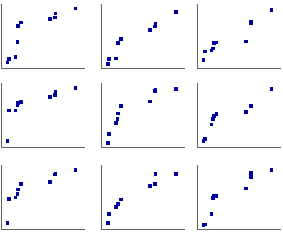
29.7.4 9 Panel Graph
9Panel-Graph
Data Requirements
Select at least one Y column of values (or a range from at least one column). Ideally, select nine or more columns of values (or a range of nine or more Y columns). If there is an associated X column, X column supplies X values; otherwise, sampling interval of the Y column or row number is used.
Please note, the number of X columns should not be more than nine for this 9 panels graph:
- if there are only one X column, this X column will be used for all panels and all Y columns will be arranged into these nine layers against the same X data; The plot arrangement rule is to plot all Y columns one by one into the layer in order and cyclically.
- if there are more than two X columns, the X columns will be used as the separator to divide the Y columns into groups, and these groups of Y columns will be plotted into into the layers in order, against the adjacent X data;
- if there are more than nine X columns, you are not allowed to plot such nine panels graph.
Creating the Graph
Select required data.
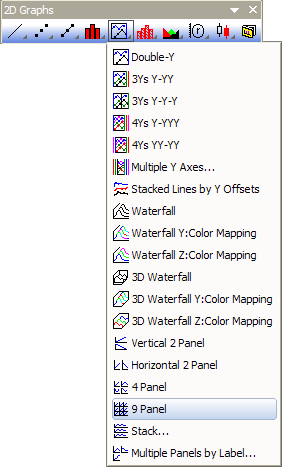
Select .
or
Click the 9 Panel button on the 2D Graphs toolbar.
Template
PAN9.OTP (installed to the Origin program folder).
Notes
Each column of Y values plots into a separate layer. The layers are arranged in three columns by three rows.