Select one or more Y columns or a range of data from at least one Y column. If there is an associated X column, X column supplies X values; otherwise, sampling interval of the Y column or row number is used.
Select required data.
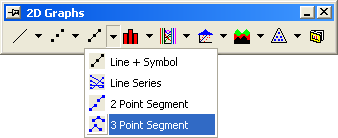
From the menu, select .
or
Click the 3 Point Segment button on the 2D Graphs toolbar.
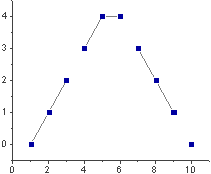
The 3 Point Segment graph is created from the LINESYMB.OTP template (installed to the Origin program folder).
The line connection display alternates between a straight line for three data points, then no line to the next data point, a straight line for three data points, etc. (the connection type is set to 3 Point Segment on the Line tab of the Plot Details dialog box ()). Thus, every three consecutive data points are connected by two lines (the first, second, and third data points; the fourth, fifth, and sixth data points; etc.). The data points are displayed as symbols.