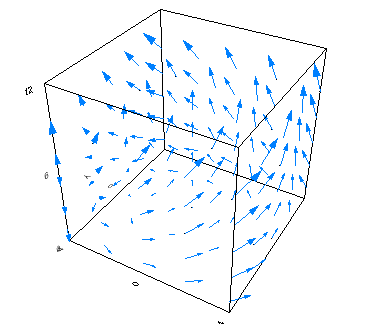
31.17.11 3D Vector XYZ dXdYdZ
Data Requirements
You need to select 6 columns in a worksheet and set their designation as XYZ XYZ.
 | You are allowed to enable 3D Vector after you plot a 3D scatter plot, please refer to this help page. |
Creating the Graph
Activate a worksheet and select the desired data.
From the menu, choose .
or
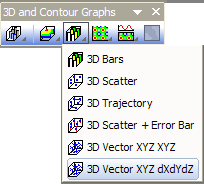
Click the 3D Vector XYZ dXdYdZ button on the 3D and Contour Graphs toolbar.
Template
- gl3DVector2.OTP (OpenGL)
- 3DVECTOR2.OTP
(Installed to the Origin program folder).
Notes
The 3D Vector plot is also called as 3D Quiver plot.
This graph type creates the vector dXdYdZ from the starting point XYZ. You can customize the color, length, etc. in the 3D Vector tab in the Plot Details dialog.